The Production Possibilities Frontier (PPF): Illustrating Scarcity, Choice, and Economic Potential
Have you ever had to choose between two things you really wanted? Maybe studying for an exam or going out with friends? Or perhaps, as a country, investing in healthcare or building more roads? Life, whether for an individual, a business, or an entire nation, is a continuous series of choices, driven by the fundamental truth that our resources are limited.
In economics, there’s a powerful and elegant tool that helps us visualize these dilemmas: the Production Possibilities Frontier (PPF). Often called the Production Possibilities Curve (PPC), this simple graph unlocks profound insights into scarcity, choice, opportunity cost, and the very limits of what an economy can achieve.
This article will break down the PPF in an easy-to-understand way, showing you how it illustrates core economic principles and why it’s so important for understanding our world.
What is the Production Possibilities Frontier (PPF)?
At its core, the Production Possibilities Frontier (PPF) is a graph that shows the various combinations of two goods or services that an economy can produce efficiently, given its available resources and technology, at a specific point in time.
Think of it like a "production ceiling" or a "boundary." It represents the maximum output an economy can achieve when it’s using all its resources (like land, labor, capital, and entrepreneurship) in the best possible way. Any point on this frontier signifies efficient production, while points inside represent inefficiency, and points outside are currently unattainable.
In simpler terms: The PPF answers the question, "If we have X amount of resources and Y level of technology, what’s the most we can possibly make of Product A if we also want to make Z amount of Product B?"
The Building Blocks of the PPF: Key Assumptions
To keep things simple and focus on the core concepts, the PPF model relies on a few key assumptions:
- Fixed Resources: The total quantity and quality of resources (land, labor, capital, entrepreneurship) available in the economy are fixed during the period under consideration.
- Fixed Technology: The state of technology remains constant. There are no new inventions or improvements that would allow for more efficient production.
- Full Employment and Efficiency: All available resources are being fully and efficiently utilized. This means there’s no wasted labor, idle factories, or uncultivated land.
- Two Goods/Services: For simplicity, the economy is assumed to produce only two types of goods or services. This allows us to plot them on a two-dimensional graph. (In reality, an economy produces millions of goods, but the principle extends.)
Visualizing the PPF: A Simple Example
Let’s imagine a small, simplified economy that can produce only two goods: Computers and Wheat.
Here’s a hypothetical Production Possibilities Schedule (Table):
| Possibility | Computers (Units) | Wheat (Tons) |
|---|---|---|
| A | 0 | 100 |
| B | 10 | 90 |
| C | 20 | 70 |
| D | 30 | 40 |
| E | 40 | 0 |
If we plot these points on a graph with "Computers" on the X-axis and "Wheat" on the Y-axis, and then connect them, we get our Production Possibilities Frontier:
- Point A: If the economy dedicates all its resources to producing wheat, it can produce 100 tons of wheat and 0 computers.
- Point E: If the economy dedicates all its resources to producing computers, it can produce 40 units of computers and 0 tons of wheat.
- Points B, C, D: Represent various combinations of computers and wheat that the economy can produce when resources are fully and efficiently utilized.

(Image courtesy of Wikimedia Commons)
Key Economic Concepts Illustrated by the PPF
The PPF is a powerful tool because it clearly demonstrates several fundamental economic principles:
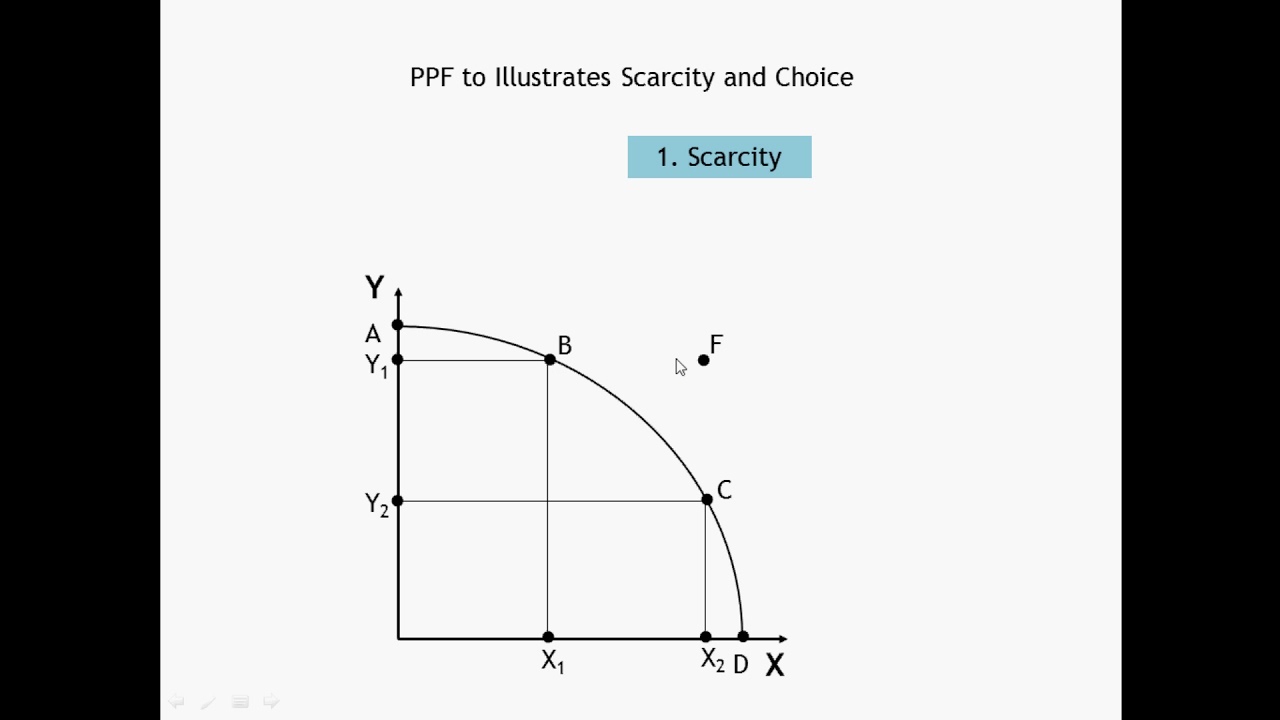
1. Scarcity
- What it means: Scarcity is the basic economic problem that arises because people have unlimited wants but resources are limited. We simply can’t have everything we want.
- How the PPF shows it: The very existence of the PPF demonstrates scarcity. The frontier itself represents the limit of what can be produced. Any point outside the PPF (like Point G in the image above) is currently unattainable given the economy’s current resources and technology. This shows that resources are finite, and there are boundaries to production.
2. Choice
- What it means: Because of scarcity, we are forced to make choices. Every decision to produce more of one good means producing less of another.
- How the PPF shows it: Moving along the PPF from one point to another (e.g., from Point B to Point C) illustrates choice. To get more computers (moving from 10 to 20 units), the economy must choose to produce less wheat (moving from 90 to 70 tons). The curve highlights the trade-offs inherent in resource allocation.
3. Opportunity Cost
- What it means: Opportunity cost is the value of the next best alternative that must be forgone when a choice is made. It’s "what you give up to get something else."
-
How the PPF shows it: The slope of the PPF represents the opportunity cost.
- From Point B to Point C: To produce 10 more computers (from 10 to 20), the economy gives up 20 tons of wheat (from 90 to 70). So, the opportunity cost of 1 computer is 2 tons of wheat (20 tons / 10 computers).
- From Point C to Point D: To produce 10 more computers (from 20 to 30), the economy gives up 30 tons of wheat (from 70 to 40). The opportunity cost of 1 computer is now 3 tons of wheat (30 tons / 10 computers).
Notice how the opportunity cost changes? This leads us to another important concept:
- Law of Increasing Opportunity Cost: The PPF is typically bowed outward (concave to the origin). This shape illustrates the Law of Increasing Opportunity Cost. As an economy produces more and more of one good, the opportunity cost of producing an additional unit of that good tends to increase.
- Why? Resources are not equally adaptable to producing all goods. When an economy first shifts resources from wheat to computers, it will reallocate those resources that are least productive in wheat farming but most productive in computer manufacturing. As it continues to shift, it must use resources that are progressively better suited for wheat production and less suited for computer production, making the cost of additional computers increasingly higher in terms of foregone wheat.
4. Efficiency
- What it means: In economics, productive efficiency means producing goods and services with the optimal combination of inputs to produce the maximum output from the given resources and technology. There’s no waste.
- How the PPF shows it: Any point on the PPF (like A, B, C, D, or E) represents productive efficiency. At these points, the economy is fully utilizing all its resources and producing the maximum possible output of both goods.
5. Inefficiency / Unemployment
- What it means: Inefficiency occurs when an economy is not fully utilizing its resources, leading to production levels below its potential. This often manifests as unemployment (idle labor) or underutilization of other resources (idle factories).
- How the PPF shows it: Any point inside the PPF (like Point F in the image above) represents inefficient production. At Point F, the economy is producing fewer computers and less wheat than it could be, given its resources. This indicates that some resources are either unemployed (e.g., jobless workers) or underutilized (e.g., factories running below capacity). The economy can move from an inefficient point like F to a point on the frontier without giving up any of one good, simply by better utilizing its resources.
Shifting the PPF: Economic Growth and Decline
The PPF is not static; it can shift. These shifts are crucial for understanding economic growth and decline.
Outward Shift (Economic Growth)
An outward shift of the PPF (meaning the entire curve moves further away from the origin) indicates economic growth. This means the economy can now produce more of both goods than before. Causes of an outward shift include:
- Increase in Quantity of Resources: Discovering new natural resources, an increase in the labor force (e.g., population growth, immigration), or an increase in the capital stock (e.g., more factories, machinery).
- Improvement in Quality of Resources: Better education and training for workers (human capital), leading to increased productivity.
- Technological Advancements: New inventions, more efficient production methods, or better management techniques that allow more output to be produced with the same amount of inputs.
- Specialization and Trade: Engaging in international trade can effectively push an economy beyond its domestic PPF, allowing it to consume more than it could produce on its own.
Inward Shift (Economic Decline)
An inward shift of the PPF (meaning the entire curve moves closer to the origin) indicates economic decline or a reduction in the economy’s productive capacity. Causes include:
- Decrease in Quantity of Resources: Natural disasters (earthquakes, tsunamis) that destroy infrastructure or resources, a decline in the labor force (e.g., due to disease, emigration), or depletion of natural resources.
- Decrease in Quality of Resources: A decline in education or health standards leading to a less productive workforce.
- Technological Regression: While rare, a loss of technological knowledge could lead to an inward shift.
Why is the PPF Important for Everyone?
Understanding the Production Possibilities Frontier isn’t just an academic exercise for economists; it offers vital insights for:
- Policymakers: Governments use these principles to make tough decisions about resource allocation. Should they invest more in healthcare or defense? Education or infrastructure? The PPF helps them visualize the trade-offs and opportunity costs of these choices.
- Businesses: Companies face their own PPFs. How much should they invest in research and development versus current production? Marketing versus product improvement?
- Individuals: Even at a personal level, the PPF concept applies. You have limited time and money. How do you allocate your study hours between different subjects? How do you spend your income between necessities and luxuries? Every choice has an opportunity cost.
The PPF reminds us that every economic decision has consequences, and resources are always finite. It’s a fundamental visual representation of the economic reality we all live in.
Conclusion
The Production Possibilities Frontier (PPF) is more than just a curve on a graph; it’s a powerful conceptual tool that brings to life the core challenges and opportunities within any economy. By illustrating the boundaries of what’s possible, the PPF vividly demonstrates the universal concepts of scarcity and the inevitable choices we must make. It quantifies the opportunity cost of those choices, highlights the importance of efficiency, and paints a clear picture of what economic growth truly entails.
Whether you’re a student beginning your journey into economics, a business leader making strategic decisions, or simply a curious individual trying to understand the world around you, grasping the PPF provides a foundational understanding of how resources are allocated, how societies progress, and why trade-offs are an inescapable part of life.
: Illustrating Scarcity, Choice, and Economic Potential")


Post Comment