Producer Price Index (PPI): Your Early Warning System for Inflation
Inflation. It’s a word that dominates headlines, influences our shopping carts, and shapes major economic decisions. We all feel its pinch when prices at the grocery store or gas pump go up. But what if there was an early signal, a "canary in the coal mine," that could tell us what’s coming before it hits our wallets?
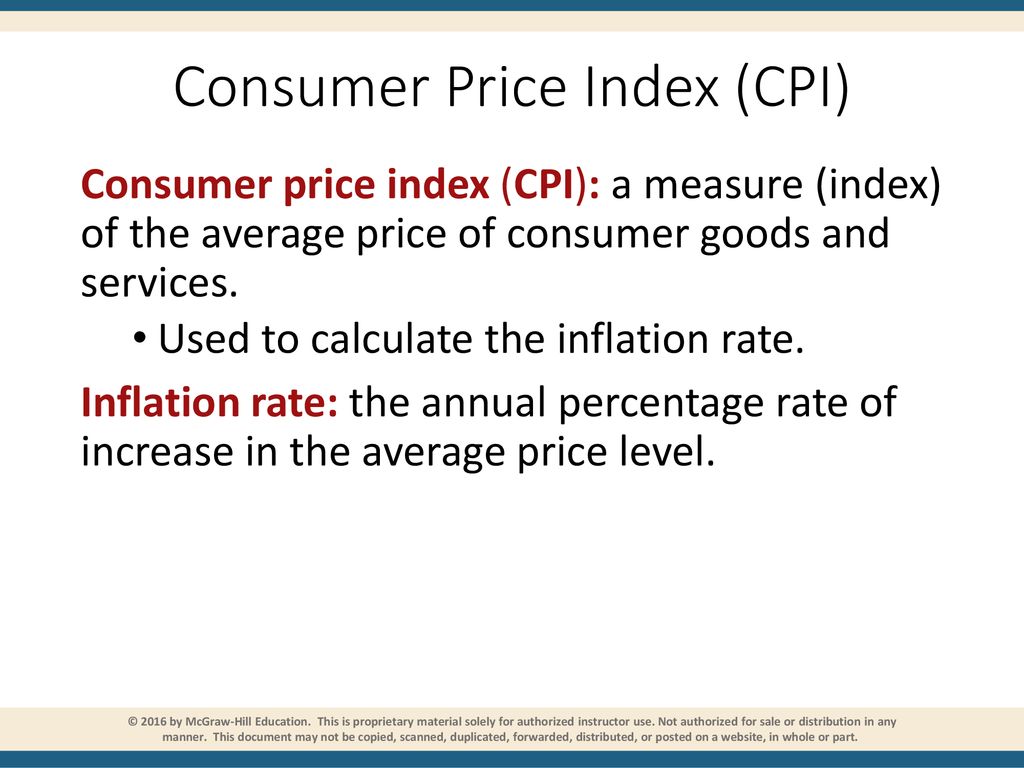
Enter the Producer Price Index (PPI). While many people are familiar with the Consumer Price Index (CPI), which tracks the prices we, as consumers, pay, the PPI offers a crucial look at what producers are paying and receiving. This seemingly technical economic indicator is, in fact, a powerful leading indicator of inflation, providing vital clues about the future direction of prices.
Understanding PPI isn’t just for economists or investors; it’s a key piece of the puzzle for anyone looking to make sense of the economy and anticipate changes that could affect their personal finances and business decisions.
What Exactly is the Producer Price Index (PPI)?
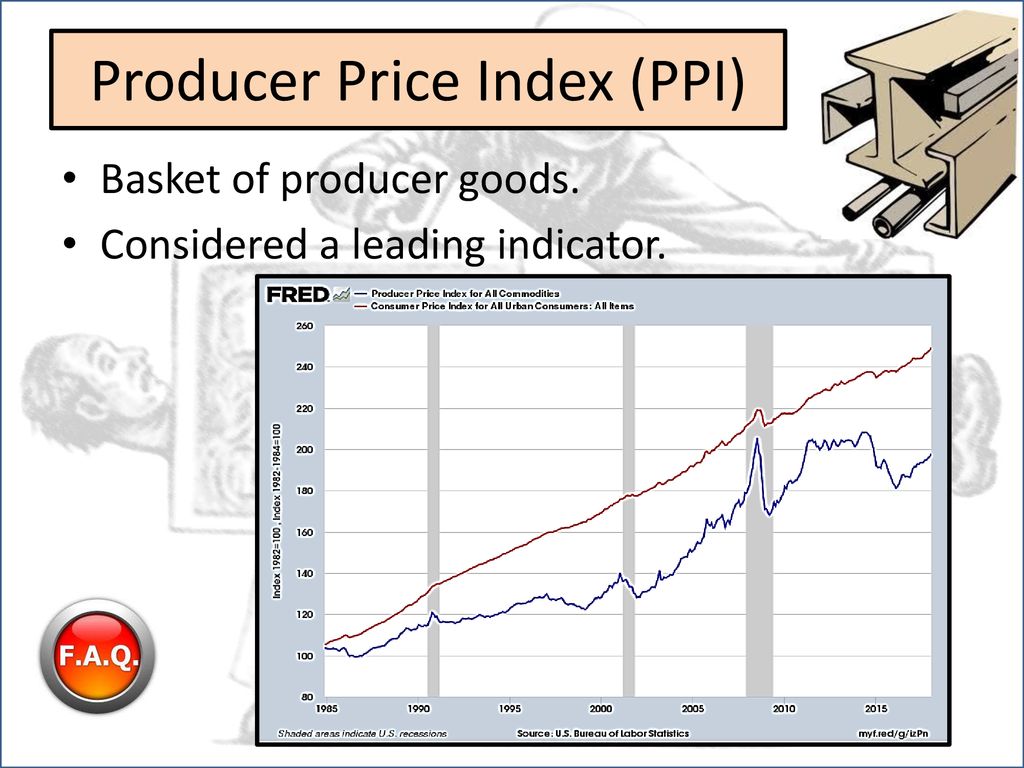
At its core, the Producer Price Index (PPI) measures the average change over time in the selling prices received by domestic producers for their output. Think of it as a peek behind the curtain of the economy, showing us the wholesale prices producers are getting for their goods and services before they reach the consumer.
- Who measures it? The U.S. Bureau of Labor Statistics (BLS) collects and publishes this data monthly.
- What does it cover? Unlike the CPI, which focuses on what consumers buy, the PPI tracks prices at different stages of the production process, from raw materials to finished goods and services.
- Why is it important? It reflects the costs and revenues of businesses. When producers face higher costs, they often pass those costs along to consumers, making the PPI a valuable predictor of future consumer price inflation (CPI).
The Mechanics: How PPI is Measured and What It Covers
The BLS collects vast amounts of data from thousands of businesses across nearly all goods-producing sectors of the U.S. economy, as well as a growing portion of the services sector. They survey producers about the prices they receive for their products and services.
To give us a clearer picture, the PPI is broken down into different categories based on the stage of production:
- PPI for Finished Goods: This measures prices for products that are ready for immediate use by consumers or businesses without further processing. Examples include cars, televisions, bread, or gasoline. This is often the most watched category as it’s closest to what consumers eventually buy.
- PPI for Intermediate Goods: These are products that have undergone some processing but require further processing before they are ready for final use. Think of things like steel sheets (used to make cars), flour (used to make bread), or lumber (used in construction).
- PPI for Crude Goods: This category tracks prices for raw materials entering the production process for the first time. Examples include crude oil, raw cotton, or unprocessed agricultural products like corn or wheat.
Why the different stages? Imagine a baker. First, they buy crude goods like wheat. Then, a mill processes the wheat into an intermediate good: flour. Finally, the baker uses the flour to make a finished good: bread. Price changes at each stage can ripple through the entire supply chain.
Beyond Goods: The Growing Role of Services
It’s important to note that PPI isn’t just about physical products. The BLS has significantly expanded its coverage to include prices for a wide range of services, such as:
- Transportation and warehousing
- Wholesale and retail trade
- Healthcare services
- Financial services
This comprehensive approach makes the PPI an even more powerful indicator, as the services sector makes up a large and growing portion of the economy.
Understanding "Core PPI"
When analysts discuss PPI, you’ll often hear about "Core PPI." This is a crucial measure that excludes the volatile food and energy sectors. Food and energy prices can swing wildly due to factors like weather, geopolitical events, or sudden supply disruptions. By stripping these out, Core PPI provides a clearer picture of underlying inflationary pressures that are less prone to temporary shocks. Policymakers, like the Federal Reserve, often pay close attention to Core PPI for this reason.
Why PPI is a "Leading Indicator" of Inflation
The term "leading indicator" is key to understanding PPI’s significance. It means that changes in the PPI often precede changes in other economic measures, particularly the Consumer Price Index (CPI). Here’s why:
- The Supply Chain Effect: Businesses operate within a supply chain. When the cost of raw materials (crude goods) or partly finished products (intermediate goods) goes up, producers face higher input costs.
- Passing on Costs: To maintain their profit margins, businesses typically pass these higher costs along to the next stage in the supply chain. This means:
- Higher raw material costs lead to higher intermediate goods prices.
- Higher intermediate goods prices lead to higher finished goods prices at the wholesale level.
- Ultimately, these higher wholesale prices often translate into higher retail prices for consumers.
- Time Lag: This entire process takes time. A jump in crude oil prices (a PPI component) won’t immediately show up at the gas pump (a CPI component). It needs to be refined, transported, and sold. This time lag is precisely what makes PPI a leading indicator. It gives us an early signal of potential inflation down the road, usually a few weeks or months before it appears in consumer prices.
Think of it like this: If the cost of ingredients for a cake goes up for the baker (PPI), it’s highly likely the price of the cake you buy at the store will eventually increase (CPI). The PPI tells you about the ingredient costs first.
PPI vs. CPI: Understanding the Differences and Relationship
While both PPI and CPI are vital measures of inflation, they look at prices from different angles.
| Feature | Producer Price Index (PPI) | Consumer Price Index (CPI) |
|---|---|---|
| Perspective | Measures prices from the seller’s/producer’s perspective (what they receive). | Measures prices from the buyer’s/consumer’s perspective (what they pay). |
| Scope | Focuses on wholesale prices, input costs, and services sold to other businesses. | Focuses on retail prices for a basket of goods and services purchased by households. |
| Coverage | Includes raw materials, intermediate goods, finished goods, and services sold to businesses. | Includes a wide range of everyday consumer purchases: food, housing, transportation, medical care, etc. |
| Importance | A leading indicator of inflation, indicating future price pressures. | A lagging or coincident indicator, reflecting current inflation experienced by consumers. |
| Key Use | Business planning, forecasting inflation, monetary policy decisions (especially the Fed). | Adjusting wages, social security benefits, and understanding the cost of living. |
The Relationship: The most important takeaway is their relationship: PPI often acts as a precursor to CPI. A significant rise in PPI typically signals that businesses are facing higher costs, and these costs will likely be passed on to consumers, leading to a rise in CPI in the near future. However, the correlation isn’t always perfect, as other factors like consumer demand and competitive pressures also play a role in final retail prices.
The Impact of PPI on the Economy and You
The Producer Price Index isn’t just an abstract economic number; its movements have real-world implications for various stakeholders:
1. Businesses
- Pricing Strategies: A rising PPI signals increasing input costs, forcing businesses to consider raising their own prices to maintain profit margins.
- Profit Margins: If businesses can’t fully pass on higher costs, their profit margins will shrink, affecting their bottom line and stock performance.
- Supply Chain Management: Businesses closely monitor PPI for specific industries to anticipate supply cost changes and adjust their purchasing and inventory strategies.
- Investment Decisions: High PPI can make businesses hesitant to invest in expansion, as future costs are uncertain.
2. Consumers
- Future Prices: While PPI doesn’t directly impact your current spending, it’s a strong indicator of what you might pay for goods and services in the coming months. A rising PPI often means a rising CPI is on the horizon, eroding purchasing power.
- Budgeting: Understanding PPI trends can help you anticipate future cost-of-living increases and adjust your personal budget accordingly.
3. Investors
- Stock Market: Rising PPI can signal lower corporate profits (if costs can’t be passed on) or higher revenue (if prices are passed on successfully). It influences investor sentiment and stock valuations, particularly for companies sensitive to raw material costs.
- Bond Market: Higher PPI readings suggest greater inflationary pressures, which often lead to higher interest rates (as the Federal Reserve tries to combat inflation). This, in turn, can make bonds less attractive or cause their prices to fall.
- Commodities: PPI movements are closely tied to commodity prices, which directly impact industries like energy, agriculture, and mining.
4. Policymakers (Especially the Federal Reserve)
- Monetary Policy: The Federal Reserve closely watches PPI data, especially Core PPI, as it’s a key input for their interest rate decisions. If PPI is consistently rising, it signals persistent inflationary pressures, which could prompt the Fed to raise interest rates to cool down the economy and bring inflation under control.
- Economic Forecasts: PPI data helps the Fed and other government bodies formulate accurate economic forecasts and policy responses.
Interpreting PPI Data: What to Look For
When the BLS releases its monthly PPI report, here’s what to pay attention to:
- Month-over-Month (MoM) Change: This tells you how prices changed from the previous month. A significant increase or decrease can signal a shift in inflationary pressure.
- Year-over-Year (YoY) Change: This compares the current month’s PPI to the same month in the previous year. It provides a broader perspective on inflation trends and smooths out short-term volatility.
- Core PPI vs. Headline PPI: Always look at both. Core PPI (excluding food and energy) gives insight into underlying, more persistent inflation, while the headline number reflects the full picture, including volatile components.
- Disaggregated Data: Don’t just look at the overall PPI. The report provides detailed breakdowns by industry and product type. For example, if you’re interested in the housing market, you might look at PPI for construction materials. If you’re concerned about food prices, check agricultural PPIs.
- Trends Over Time: A single month’s data point is less important than the trend over several months. Is PPI consistently rising, falling, or remaining stable?
- Context is Key: Interpret PPI data within the broader economic context. Is the economy growing or contracting? What are global supply chain conditions like? What are energy prices doing?
Conclusion
The Producer Price Index (PPI) might not grab as many headlines as the Consumer Price Index (CPI), but its role as a leading indicator of inflation makes it an indispensable tool for understanding economic trends. By providing an early glimpse into the costs faced by businesses, PPI offers valuable foresight into potential future price increases that will eventually affect consumers.
For businesses, it’s a guide for pricing and operational decisions. For investors, it’s a signal for market movements. For policymakers, it’s a crucial input for monetary policy. And for you, the everyday person, it’s an early warning system, helping you anticipate shifts in your cost of living and make more informed financial decisions. Paying attention to PPI can help you stay ahead of the curve in an ever-changing economic landscape.
.jpg "Producer Price Index (PPI): Your Early Warning System for Inflation")

Post Comment