Mastering Financial Statement Analysis for Investors: Your Guide to Smarter Investing
The stock market can feel like a complex maze, full of jargon and fluctuating numbers. For many aspiring investors, the idea of truly understanding a company’s financial health seems daunting, a task best left to seasoned analysts. But what if we told you that the key to unlocking better investment decisions lies in a skill anyone can learn: Financial Statement Analysis?
This comprehensive guide will demystify financial statement analysis, breaking down complex concepts into easy-to-understand language. By the end, you’ll be equipped with the fundamental tools to look beyond the headlines, evaluate a company’s true performance, and make more informed, confident investment choices.
What is Financial Statement Analysis and Why Do Investors Need It?
Imagine buying a house without inspecting it, or purchasing a car without checking its engine. Investing in a company without understanding its financial health is just as risky.
Financial Statement Analysis (FSA) is the process of examining a company’s financial reports to gain insights into its performance, financial position, and cash flow. It’s like a diagnostic tool that helps investors answer critical questions:
- Is the company profitable?
- Can it pay its debts?
- Is it growing?
- Is its management efficient?
- Is it a good long-term investment?
Why is this crucial for you, the investor?
Simply put, it empowers you to:
- Make Informed Decisions: Don’t rely on hype or "hot tips." Base your investments on solid data.
- Identify Strong Companies: Pinpoint businesses with healthy fundamentals and sustainable growth potential.
- Assess Risk: Understand a company’s vulnerabilities and avoid those teetering on the brink.
- Spot Undervalued Opportunities: Find companies whose stock price might not yet reflect their true value.
- Monitor Existing Investments: Keep an eye on the companies you already own to ensure they remain good investments.
The Big Three: Your Essential Financial Documents
Every publicly traded company is required to release its financial results regularly. These are compiled into three primary statements that form the backbone of your analysis:
1. The Income Statement (Also Known as Profit & Loss or P&L)
Think of the Income Statement as a movie of a company’s financial performance over a period (typically a quarter or a year). It shows you how much revenue the company generated and what expenses it incurred to generate that revenue, ultimately leading to its profit or loss.
Key Sections to Look For:
- Revenue (Sales): The total money earned from selling goods or services. This is the top line.
- Cost of Goods Sold (COGS): The direct costs associated with producing the goods or services sold (e.g., raw materials, labor).
- Gross Profit: Revenue minus COGS. This tells you how much profit a company makes from its core operations before considering other expenses.
- Operating Expenses: Costs not directly tied to production, such as:
- Selling, General & Administrative (SG&A): Marketing, salaries, rent, utilities.
- Research & Development (R&D): Investment in new products or technologies.
- Operating Income (EBIT – Earnings Before Interest & Taxes): Gross Profit minus Operating Expenses. This shows the profit generated from the company’s core business activities.
- Interest Expense: The cost of borrowing money.
- Taxes: Payments to the government.
- Net Income (The Bottom Line): What’s left after all expenses, including taxes and interest, are deducted from revenue. This is the company’s ultimate profit.
What the Income Statement Tells You: Is the company actually making money? Is its revenue growing? Are its costs under control?
2. The Balance Sheet
While the Income Statement is a movie, the Balance Sheet is a snapshot of a company’s financial health at a specific point in time (e.g., December 31st). It follows the fundamental accounting equation:
Assets = Liabilities + Shareholder’s Equity
Key Sections to Look For:
- Assets: What the company owns that has value and can generate future economic benefits.
- Current Assets: Can be converted to cash within one year (e.g., cash, accounts receivable, inventory).
- Non-Current Assets (Long-Term Assets): Not easily converted to cash within one year (e.g., property, plant & equipment (PP&E), intangible assets like patents).
- Liabilities: What the company owes to others.
- Current Liabilities: Debts due within one year (e.g., accounts payable, short-term loans).
- Non-Current Liabilities (Long-Term Liabilities): Debts due in more than one year (e.g., long-term bonds, deferred revenue).
- Shareholder’s Equity: The residual value of the company’s assets after all liabilities are paid. This represents the owners’ stake in the company.
- Common Stock: The value of shares issued to investors.
- Retained Earnings: Accumulated profits that the company has kept and reinvested in the business rather than paying out as dividends.
What the Balance Sheet Tells You: How much the company owns, how much it owes, and how much is left for the owners. Is it financially stable? Is it overleveraged (too much debt)?
3. The Cash Flow Statement
The Cash Flow Statement is often considered the most honest of the three. It tracks all the actual cash coming into and going out of a company over a period. Unlike the Income Statement, which can include non-cash items (like depreciation), the Cash Flow Statement focuses purely on cash, making it harder to manipulate.
Key Sections to Look For:
- Cash Flow from Operating Activities (CFO): Cash generated or used by the company’s normal business operations. This is often seen as the most important section, indicating how well a company generates cash from its core business.
- Cash Flow from Investing Activities (CFI): Cash used for or generated from the purchase or sale of long-term assets (e.g., buying new equipment, selling property, investing in other companies).
- Cash Flow from Financing Activities (CFF): Cash related to debt and equity transactions (e.g., issuing new stock, paying dividends, borrowing money, repaying loans).
- Net Increase/Decrease in Cash: The sum of the three sections, showing the overall change in the company’s cash balance.
What the Cash Flow Statement Tells You: Does the company generate enough cash to fund its operations, growth, and debt obligations? Is it truly cash-rich, or just showing accounting profits?
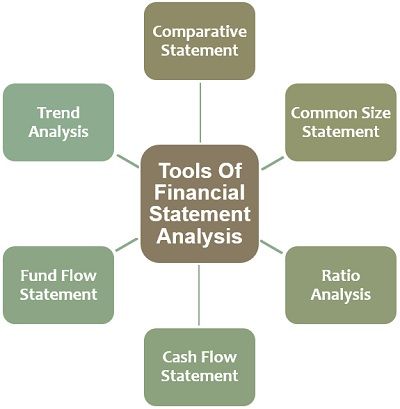
Core Techniques for Financial Statement Analysis
Once you have the "Big Three" statements, how do you actually analyze them? Here are the primary techniques:
1. Trend Analysis (Horizontal Analysis)
This involves comparing financial data over multiple periods (e.g., year over year, quarter over quarter). It helps you identify growth patterns, declines, and significant changes in financial performance.
- Example: Comparing a company’s revenue over the last five years to see if it’s consistently growing or experiencing volatility.
- Benefit: Reveals the trajectory of a company’s performance. Is it improving, declining, or stagnant?
2. Common-Size Analysis (Vertical Analysis)
This technique expresses each line item on a financial statement as a percentage of a base figure within the same period.
- For Income Statement: Each line item is expressed as a percentage of Total Revenue. This helps you see how much of each revenue dollar goes to COGS, operating expenses, and ultimately, net income.
- For Balance Sheet: Each asset is expressed as a percentage of Total Assets, and each liability/equity item as a percentage of Total Liabilities & Equity. This shows the composition of a company’s assets and how its assets are financed.
- Benefit: Allows for easy comparison between companies of different sizes and helps identify changes in the company’s financial structure or cost efficiency over time.
3. Financial Ratios: The Investor’s Magnifying Glass
Financial ratios are powerful tools that distill complex financial data into easily digestible metrics. They allow you to compare a company’s performance against its own historical data, competitors, or industry averages.
Here are some essential categories of ratios for investors:
A. Profitability Ratios (How good is the company at making money?)
These ratios measure a company’s ability to generate earnings relative to its revenue, operating costs, balance sheet assets, or shareholder’s equity.
- Gross Profit Margin:
(Gross Profit / Revenue) x 100%- What it tells you: The percentage of revenue left after accounting for the cost of goods sold. A higher margin indicates better pricing power or efficient production.
- Net Profit Margin:
(Net Income / Revenue) x 100%- What it tells you: The percentage of revenue left after all expenses, including taxes and interest, have been deducted. This is the ultimate measure of profitability from each dollar of sales.
- Return on Assets (ROA):
(Net Income / Average Total Assets) x 100%- What it tells you: How efficiently a company is using its assets to generate profit. A higher ROA suggests better asset utilization.
- Return on Equity (ROE):
(Net Income / Average Shareholder's Equity) x 100%- What it tells you: How much profit the company generates for each dollar of shareholder equity. A higher ROE indicates effective use of shareholder investments.
B. Liquidity Ratios (Can the company pay its short-term bills?)
These ratios measure a company’s ability to meet its short-term obligations (those due within one year).
- Current Ratio:
Current Assets / Current Liabilities- What it tells you: The extent to which current assets cover current liabilities. A ratio of 1.5-2.0 or higher is generally considered healthy, but it varies by industry.
- Quick Ratio (Acid-Test Ratio):
(Current Assets - Inventory) / Current Liabilities- What it tells you: A more conservative measure than the current ratio, as it excludes inventory (which may not be easily converted to cash). A ratio of 1.0 or higher is often preferred.
C. Solvency Ratios (Can the company pay its long-term debts?)
These ratios assess a company’s ability to meet its long-term financial obligations.
- Debt-to-Equity Ratio:
Total Debt / Shareholder's Equity- What it tells you: The proportion of debt financing relative to equity financing. A high ratio indicates greater reliance on debt, which can be risky.
- Interest Coverage Ratio:
EBIT / Interest Expense- What it tells you: How easily a company can pay its interest expenses. A higher number indicates a company can comfortably cover its interest payments.
D. Efficiency Ratios (How well is the company using its assets?)
These ratios measure how effectively a company is utilizing its assets and managing its liabilities.
- Inventory Turnover:
Cost of Goods Sold / Average Inventory- What it tells you: How many times a company sells and replaces its inventory over a period. A higher turnover generally indicates efficient inventory management.
- Days Sales Outstanding (DSO) / Accounts Receivable Turnover:
(Average Accounts Receivable / Revenue) x 365(for DSO)- What it tells you: The average number of days it takes for a company to collect its credit sales. Lower DSO is generally better.
E. Valuation Ratios (Is the stock price reasonable?)
While financial statement analysis focuses on the company’s performance, these ratios connect that performance to the stock price, helping you assess if a stock is potentially undervalued or overvalued.
- Price-to-Earnings (P/E) Ratio:
Current Stock Price Per Share / Earnings Per Share (EPS)- What it tells you: How much investors are willing to pay for each dollar of a company’s earnings. A high P/E often suggests investors expect high future growth.
- Price-to-Book (P/B) Ratio:
Current Stock Price Per Share / Book Value Per Share- What it tells you: Compares a company’s market value to its book value (assets minus liabilities). A P/B below 1 can indicate an undervalued stock, but context is crucial.
- Dividend Yield:
Annual Dividends Per Share / Current Stock Price Per Share- What it tells you: The percentage return an investor receives in dividends relative to the stock’s price. Important for income-focused investors.
Important Note on Ratios:
- Context is King: A ratio’s meaning is relative. Always compare a company’s ratios to:
- Its own historical performance (trend analysis).
- Industry averages (what’s normal for this type of business?).
- Competitors (who’s doing better or worse?).
- No Single "Perfect" Ratio: Look at a combination of ratios to get a holistic view.
Beyond the Numbers: Qualitative Factors
While financial statements provide crucial quantitative data, they don’t tell the whole story. Smart investors also consider qualitative factors:
- Management Quality: Who leads the company? What’s their track record, vision, and integrity?
- Industry Outlook: Is the industry growing, mature, or declining? What are the competitive forces at play?
- Competitive Advantage (Moat): Does the company have something that makes it difficult for competitors to replicate (e.g., strong brand, patents, network effects, cost advantage)?
- Brand Strength and Reputation: How well-regarded is the company and its products/services?
- Regulatory Environment: Are there any government regulations that could significantly impact the business?
- Economic Conditions: How might broader economic trends affect the company?
Combining quantitative financial analysis with qualitative insights gives you the most complete picture of a company’s investment potential.
Practical Steps for Investors to Begin Financial Statement Analysis
Ready to dive in? Here’s how to start:
- Choose a Company: Pick a company you’re interested in or already own.
- Locate Financial Statements:
- Company Investor Relations: Most public companies have an "Investor Relations" section on their website where you can find annual reports (10-K) and quarterly reports (10-Q).
- SEC EDGAR Database: The U.S. Securities and Exchange Commission (SEC) provides free access to all public company filings. This is the definitive source.
- Start with the Income Statement: Look at revenue and net income trends over several years. Is it growing consistently?
- Move to the Balance Sheet: Check current assets vs. current liabilities (liquidity). How much debt does the company have?
- Analyze the Cash Flow Statement: Is the company generating positive cash from its operations? Where is its cash going?
- Calculate Key Ratios: Pick a few key ratios from each category (profitability, liquidity, solvency, efficiency) that are most relevant to the industry.
- Compare and Contextualize:
- Compare the ratios to the company’s past performance.
- Compare them to industry averages or direct competitors.
- Consider the qualitative factors mentioned above.
- Formulate Your Opinion: Based on your analysis, does this company appear to be a good investment? What are its strengths and weaknesses?
Common Pitfalls to Avoid
- Ignoring Context: Don’t look at ratios in isolation. Always compare them to industry benchmarks and historical trends.
- Focusing Only on Net Income: A company can show accounting profits but have poor cash flow. Always review the Cash Flow Statement.
- Falling for "Creative Accounting": While rare, some companies try to manipulate their numbers. A thorough analysis across all three statements and looking for consistency can help flag red flags.
- Ignoring the Footnotes: Financial statements often have extensive footnotes explaining accounting policies, contingencies, and other crucial details. Don’t skip them!
- Analysis Paralysis: Don’t get bogged down in every single detail initially. Start with the core statements and key ratios, and build your knowledge gradually.
Conclusion: Empower Yourself Through Financial Knowledge
Financial Statement Analysis is not just for professional accountants or Wall Street gurus. It’s a fundamental skill that every investor can learn and benefit from. By understanding how to read and interpret the Income Statement, Balance Sheet, and Cash Flow Statement, and by utilizing key financial ratios, you gain a powerful advantage.
You move from guessing to knowing, from hoping to strategizing. This knowledge empowers you to make independent, well-reasoned investment decisions, assess true company value, and ultimately, build a more robust and successful investment portfolio. Start your journey today – the numbers are waiting to tell their story!
:max_bytes(150000):strip_icc()/Financial-Statement-Analysis-FINAL-224d7e8f12f246c8b29d1b99330a7b8e.jpg "Mastering Financial Statement Analysis for Investors: Your Guide to Smarter Investing")


Post Comment