HR Analytics: Using Data to Improve HR Decisions – A Beginner’s Guide to People Analytics
In today’s fast-paced business world, "gut feelings" and traditional practices are no longer enough to drive success. Every department, from sales to marketing, relies on data to make smart choices. So, why should Human Resources be any different? Enter HR Analytics, also known as People Analytics or Workforce Analytics.
This powerful approach is transforming HR from a purely administrative function into a strategic powerhouse. By using data, HR professionals can uncover hidden insights, predict future trends, and make evidence-based decisions that significantly impact a company’s bottom line and employee well-being. If you’re new to the concept, don’t worry – this comprehensive guide will break down HR Analytics in simple terms, showing you how it can revolutionize your HR strategies.
What Exactly Is HR Analytics? (No Jargon, We Promise!)
Imagine you’re trying to improve a sports team’s performance. You wouldn’t just guess what’s wrong; you’d look at stats: player speed, shooting accuracy, passing completion rates, and even how long they’re on the field. You’d use this data to understand what’s working, what’s not, and how to train more effectively.
HR Analytics is essentially the same thing, but for your workforce. It’s the process of collecting, analyzing, and interpreting data related to your employees and HR processes. This data can come from various sources:
- Employee surveys
- Performance reviews
- Recruitment systems
- Payroll records
- Training programs
- Employee engagement platforms
By looking at this data, HR professionals can gain a deeper understanding of their workforce, identify patterns, and answer critical business questions like:
- Why are our best employees leaving?
- Which training programs actually improve performance?
- What makes certain teams more productive than others?
- How can we reduce the time it takes to hire great talent?
Instead of relying on assumptions, HR Analytics provides concrete evidence to back up decisions, making HR more efficient, effective, and impactful.
Why is HR Analytics So Important Right Now?
The shift to data-driven HR isn’t just a trend; it’s a necessity. Here’s why HR Analytics is becoming indispensable for modern organizations:
- Moving Beyond Guesswork: No more "I think" or "I feel." HR Analytics provides "I know because the data shows…" This leads to more confident and accurate decisions.
- Strategic Role of HR: It elevates HR from a cost center to a strategic partner that contributes directly to business goals, like profitability and innovation.
- Understanding Your Workforce: It helps you truly know your employees – what motivates them, what frustrates them, and what makes them stay or leave.
- Competitive Advantage: Companies that effectively use HR data can make better hiring decisions, retain top talent, and build a more engaged workforce, giving them an edge over competitors.
- Cost Savings: By identifying inefficiencies in recruitment, turnover, or training, HR Analytics can lead to significant cost reductions.
- Improved Employee Experience: Understanding employee pain points and preferences allows HR to create a more positive and supportive work environment.
Key Areas Where HR Analytics Makes a Real Difference
HR Analytics isn’t just a theoretical concept; it has practical applications across almost every HR function. Let’s explore some of the most impactful areas:
1. Recruitment & Hiring Efficiency
- The Challenge: Hiring is expensive and time-consuming. How do you find the right people quickly and cost-effectively?
- How Analytics Helps:
- Source Effectiveness: Identify which recruitment channels (job boards, referrals, LinkedIn) bring in the best candidates.
- Time-to-Hire: Analyze how long it takes to fill different roles and pinpoint bottlenecks in the hiring process.
- Quality of Hire: Track the performance and retention rates of new hires from different sources to understand what predicts success.
- Candidate Experience: Use feedback data to improve the application and interview process.
2. Employee Retention & Turnover Prediction
- The Challenge: Losing good employees is costly due to lost productivity, recruitment expenses, and the drain on morale.
- How Analytics Helps:
- Flight Risk Identification: Predict which employees are most likely to leave based on factors like tenure, performance, salary, or engagement survey results.
- Root Cause Analysis: Understand why employees are leaving by analyzing exit interview data and comparing it to internal data. Is it management? Compensation? Lack of growth?
- Retention Strategies: Develop targeted interventions (e.g., mentorship programs, salary adjustments, new growth opportunities) for at-risk employees or groups.
3. Performance Management & Productivity
- The Challenge: How do you objectively measure performance and identify factors that lead to higher productivity?
- How Analytics Helps:
- Performance Drivers: Correlate performance data with other factors like training completed, team structure, or management style to see what truly impacts productivity.
- Identifying High Performers: Understand the characteristics and development paths of your top performers to replicate their success.
- Performance Gaps: Pinpoint areas where employees or teams consistently underperform and design targeted support.
4. Learning & Development (L&D) Effectiveness
- The Challenge: Are your training programs actually working? Are they worth the investment?
- How Analytics Helps:
- ROI of Training: Measure the return on investment (ROI) of L&D programs by tracking improvements in performance, productivity, or retention after training.
- Skill Gap Analysis: Identify critical skills missing in your workforce and design training to fill those gaps.
- Personalized Learning Paths: Recommend specific training modules to employees based on their roles, performance data, and career aspirations.
5. Employee Engagement & Experience
- The Challenge: How engaged and satisfied are your employees, and what can you do to improve their overall experience?
- How Analytics Helps:
- Engagement Drivers: Analyze engagement survey data to identify the key factors that drive or hinder employee engagement within your organization.
- Pulse Surveys: Use frequent, short surveys to track changes in morale and engagement over time, allowing for quick interventions.
- Feedback Loop: Connect employee feedback with HR actions and measure the impact of those actions on engagement scores.
6. Workforce Planning & Succession
- The Challenge: Do you have the right people with the right skills in the right place at the right time for future business needs?
- How Analytics Helps:
- Future Staffing Needs: Forecast future talent demands based on business growth projections, attrition rates, and strategic initiatives.
- Skill Inventory: Understand the current skill sets within your organization and identify potential future skill gaps.
- Succession Planning: Identify potential successors for critical roles and track their readiness and development paths.
The HR Analytics Process: How Does It Work?
Implementing HR Analytics might sound complex, but it generally follows a logical, step-by-step process:
-
Define the Business Question: Start with a clear question that HR data can help answer. Don’t just collect data for the sake of it.
- Example: "Why is turnover so high in our sales department?" or "Which training program leads to the highest sales increase?"
-
Collect the Right Data: Gather relevant data from various HR systems (HRIS, ATS, LMS, survey tools, payroll). Ensure data quality and accuracy – "garbage in, garbage out" applies here!
-
Analyze the Data: Use statistical methods, data visualization tools (like dashboards), and sometimes even machine learning to find patterns, correlations, and insights. This might involve:
- Comparing different groups (e.g., high vs. low performers).
- Looking for trends over time.
- Identifying relationships between different data points.
-
Interpret the Findings & Create Insights: Translate the data into clear, actionable insights. What does the data mean for your business? What story does it tell? Avoid just presenting numbers; explain their significance.
-
Act on the Insights: Use the insights to make informed HR decisions, implement new programs, or adjust existing strategies. This is where the real value of HR Analytics comes to life.
-
Monitor & Refine: Continuously track the impact of your actions. Did the changes you made based on the data actually improve the situation? What new questions arise? This creates a continuous improvement loop.
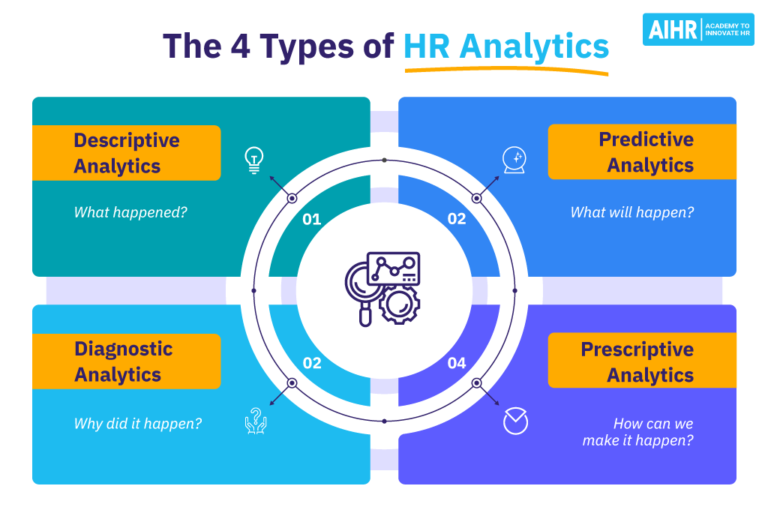
Types of HR Analytics (Simplified)
While the terms can sound intimidating, there are four main types of HR Analytics, each answering a different kind of question:
-
Descriptive Analytics (What happened?):
- This is the most basic level. It summarizes past events.
- Examples: "Our turnover rate last year was 15%." "We hired 50 new employees this quarter." "Average time-to-fill for engineering roles is 60 days."
-
Diagnostic Analytics (Why did it happen?):
- This digs deeper to understand the reasons behind past events.
- Examples: "Our turnover rate was 15% because employees felt there was a lack of career growth opportunities (identified through exit surveys)." "Sales performance declined because of insufficient product training for new hires."
-
Predictive Analytics (What will happen?):
- This uses historical data to forecast future outcomes. This is where HR becomes proactive.
- Examples: "Based on current trends, we predict a 20% increase in voluntary turnover among employees with less than two years of tenure in the next six months." "Employees who complete ‘X’ training are 30% more likely to be promoted within two years."
-
Prescriptive Analytics (What should we do?):
- This is the most advanced level. It recommends specific actions to achieve a desired outcome or prevent an undesirable one.
- Examples: "To reduce predicted turnover, we should implement a new mentorship program for employees with less than two years of tenure and offer targeted professional development courses." "To improve sales performance, we should mandate ‘X’ product training for all new sales hires."
Common HR Metrics and Key Performance Indicators (KPIs)
To get started with HR Analytics, you need to know what to measure. Here are some fundamental HR metrics and KPIs that organizations commonly track:
- Time-to-Hire: Average number of days from job opening to hire date.
- Cost-per-Hire: Total recruitment costs divided by the number of hires.
- Turnover Rate: Percentage of employees leaving the organization over a specific period.
- Voluntary Turnover Rate: Percentage of employees who choose to leave.
- Absenteeism Rate: Percentage of scheduled workdays missed due to absence.
- Employee Engagement Score: Results from employee surveys measuring commitment and enthusiasm.
- Training Completion Rate: Percentage of employees who complete assigned training.
- Promotion Rate: Percentage of employees promoted within a given period.
- Diversity Metrics: Representation of various demographic groups within the workforce.
- Performance Rating Distribution: Breakdown of employee performance scores (e.g., percentage of employees in each performance category).
Getting Started with HR Analytics: Practical Advice for Beginners
Feeling overwhelmed? Don’t be! You don’t need to be a data scientist to start leveraging HR Analytics. Here’s how to begin:
- Start Small, Think Big: Don’t try to solve every problem at once. Pick one specific, high-impact business question (e.g., "Why are we losing our top tech talent?").
- Focus on Business Problems, Not Just HR Problems: Connect your HR data to tangible business outcomes. How does employee turnover affect sales or customer satisfaction?
- Ensure Data Quality: Garbage in, garbage out! Make sure your HR data is accurate, consistent, and complete. This might involve cleaning up existing records.
- Leverage Your Existing Tools: You likely have an HR Information System (HRIS) or payroll system. Explore its reporting capabilities first. Spreadsheets (Excel, Google Sheets) are also powerful tools for basic analysis.
- Develop Basic Data Skills: Start with learning how to pull reports, use pivot tables, and create simple charts in Excel. Many free online courses are available.
- Find a "Champion": Get buy-in from a senior leader or a team manager who is excited about using data to improve their area. Their success can be a powerful example.
- Visualize Your Data: Numbers alone can be boring. Use charts, graphs, and dashboards to make your insights easy to understand and compelling for decision-makers.
- Tell a Story: Don’t just present data; tell a story with it. Explain the "so what?" and the recommended actions.
Challenges to Be Aware Of
While the benefits are immense, HR Analytics isn’t without its challenges:
- Data Quality & Accessibility: Inaccurate or siloed data can be a major hurdle.
- Lack of Skills: HR teams may lack the analytical or statistical skills needed to interpret complex data.
- Resistance to Change: Some HR professionals or leaders may prefer traditional methods or feel threatened by data.
- Privacy & Ethics: Handling sensitive employee data requires strict adherence to privacy regulations (like GDPR) and ethical considerations.
- Tooling & Technology: Investing in and integrating the right analytics software can be a significant undertaking.
The Future of HR Analytics
The field of HR Analytics is continuously evolving. We can expect to see:
- Increased Integration with AI & Machine Learning: Automating data collection, identifying complex patterns, and providing more sophisticated predictions.
- Focus on Employee Experience (EX): Deeper dives into what truly shapes the employee journey, from onboarding to exit.
- Real-time Analytics: Moving towards immediate insights and proactive interventions rather than just historical reporting.
- Ethical AI & Data Privacy: Even greater emphasis on responsible data usage and transparency.
- Broader Adoption: HR Analytics will become a standard practice, not just for large corporations, but for businesses of all sizes.
Conclusion: Empowering HR with Data-Driven Insights
HR Analytics is no longer a niche concept; it’s a fundamental shift in how Human Resources operates. By embracing data, HR professionals can move beyond administrative tasks to become true strategic partners, driving organizational performance, fostering a positive work environment, and making a tangible impact on the business’s success.
Starting your HR Analytics journey might seem daunting, but by focusing on clear questions, leveraging available data, and continuously learning, you can unlock a world of insights that will transform your HR decisions from guesswork into game-changing strategies. The future of HR is data-driven, and the time to start is now.


Post Comment