Decoding Financial Ratios: Your Beginner’s Guide to Liquidity, Profitability, and Solvency
In the vast ocean of business data, financial statements – the Income Statement, Balance Sheet, and Cash Flow Statement – can seem like complex maps filled with bewildering numbers. For the uninitiated, they might just look like a lot of accounting jargon. But what if there was a secret code, a universal language that could distill these mountains of data into clear, actionable insights?
Enter financial ratios.
Financial ratios are powerful analytical tools that help you interpret the raw numbers from a company’s financial statements. Think of them as a doctor checking your vital signs – temperature, heart rate, blood pressure. Individually, these numbers tell you something, but together, they paint a comprehensive picture of your health. Similarly, financial ratios provide a snapshot of a company’s financial health, performance, and operational efficiency.
Whether you’re an aspiring investor, a small business owner, a curious student, or simply someone who wants to understand the news better, understanding financial ratios is a fundamental skill. This long-form guide will decode the most important types of financial ratios: Liquidity, Profitability, and Solvency, breaking them down into easy-to-understand concepts for beginners.
Why Financial Ratios Matter: Beyond the Raw Numbers
Imagine a company reports $10 million in sales. Is that good or bad? You can’t tell without context. What if its expenses were $9.9 million? Or what if another company with similar sales had only $5 million in expenses? This is where ratios shine. They provide:
- Context and Comparison: Ratios allow you to compare a company’s performance over time (trend analysis) or against its competitors and industry averages.
- Early Warning Signals: They can highlight potential problems (like declining profitability or increasing debt) before they become crises.
- Insight into Efficiency: Ratios show how well a company is using its assets to generate sales or profits.
- Risk Assessment: They help evaluate a company’s ability to meet its short-term and long-term financial obligations.
- Informed Decision-Making: Investors use them to decide where to put their money, creditors use them to assess lending risk, and management uses them to guide strategic decisions.
Let’s dive into the core categories.
1. Decoding Liquidity Ratios: Can We Pay Our Bills?
Liquidity refers to a company’s ability to meet its short-term financial obligations – those debts that need to be paid within a year. Think of it as having enough cash in your wallet or bank account to cover your immediate expenses. A highly liquid company can pay its bills on time, without scrambling or selling off long-term assets.
Key Liquidity Ratios:
a) Current Ratio
The Current Ratio is perhaps the most common liquidity ratio. It tells you whether a company has enough short-term assets to cover its short-term liabilities.
-
Formula:
Current Ratio = Current Assets / Current Liabilities -
What it means:
- Current Assets: Assets that can be converted into cash within one year (e.g., cash, accounts receivable, inventory).
- Current Liabilities: Debts due within one year (e.g., accounts payable, short-term loans).
- A higher current ratio generally indicates a stronger ability to pay off short-term obligations.
-
Interpretation:
- A ratio of 1:1 means current assets equal current liabilities. While technically solvent, it leaves no room for error.
- A ratio between 1.5:1 and 2:1 is often considered healthy for many industries, suggesting the company has twice as many current assets as current liabilities.
- A ratio significantly below 1:1 could signal liquidity problems.
- A ratio that is too high (e.g., 5:1) might suggest the company isn’t efficiently using its assets (e.g., too much idle cash or excess inventory).
b) Quick Ratio (Acid-Test Ratio)
The Quick Ratio is a more conservative measure of liquidity than the Current Ratio. It excludes inventory from current assets, as inventory can sometimes be difficult or slow to convert into cash, especially in a downturn.
-
Formula:
Quick Ratio = (Current Assets - Inventory) / Current Liabilities
Alternatively:Quick Ratio = (Cash + Marketable Securities + Accounts Receivable) / Current Liabilities -
What it means: This ratio measures a company’s ability to meet its short-term obligations using only its most liquid assets.
-
Interpretation:
- A quick ratio of 1:1 or higher is generally considered healthy, meaning the company can cover its immediate debts without relying on selling inventory.
- Industries with very fast-moving inventory (like grocery stores) might have a lower quick ratio but still be healthy. Industries with slow-moving inventory (like heavy machinery) would rely more on this ratio.
2. Decoding Profitability Ratios: Are We Making Money?
Profitability ratios measure a company’s ability to generate earnings relative to its revenue, assets, or equity. Essentially, they tell you how good a company is at turning sales into profit. This is crucial because, ultimately, businesses need to make money to survive and grow.
Key Profitability Ratios:
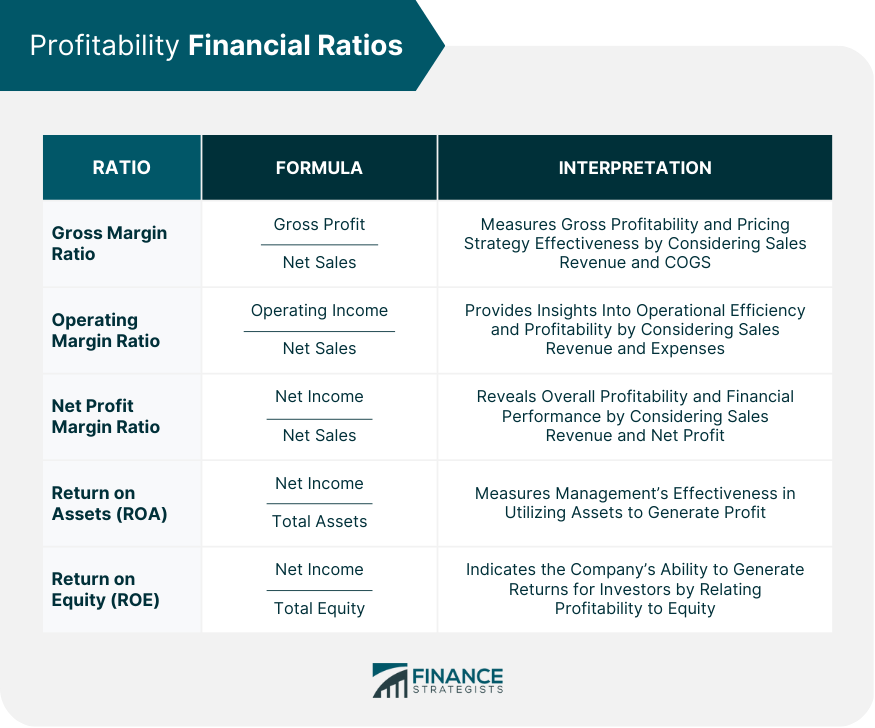
a) Gross Profit Margin
The Gross Profit Margin tells you what percentage of revenue is left after accounting for the cost of goods sold (COGS). COGS are the direct costs involved in producing the goods or services a company sells.
-
Formula:
Gross Profit Margin = (Gross Profit / Revenue) * 100%
Where Gross Profit = Revenue – Cost of Goods Sold -
What it means: It shows the efficiency of a company’s core production process. A higher margin means the company retains more money from each sale to cover operating expenses and generate net profit.
-
Interpretation:
- A higher percentage is generally better, indicating efficient production or strong pricing power.
- Compare this ratio to industry averages to see if a company is more or less efficient than its peers.
b) Net Profit Margin
The Net Profit Margin is the ultimate profitability measure, showing how much profit a company makes from every dollar of revenue after all expenses, including taxes and interest, have been deducted.
-
Formula:
Net Profit Margin = (Net Income / Revenue) * 100% -
What it means: This ratio reveals the overall efficiency of a company in converting revenue into actual profit available to shareholders.
-
Interpretation:
- A higher percentage indicates greater overall profitability.
- This ratio is highly sensitive to changes in sales, expenses, and taxes.
- Always compare net profit margins within the same industry, as different sectors naturally have varying typical margins.
c) Return on Assets (ROA)
Return on Assets (ROA) measures how efficiently a company is using its total assets to generate profit. It tells you how much profit each dollar of assets is generating.
-
Formula:
Return on Assets (ROA) = (Net Income / Total Assets) * 100% -
What it means: This ratio gives investors an idea of how effective the company is at converting the money it has invested in assets into net income.
-
Interpretation:
- A higher ROA indicates better asset utilization and operational efficiency.
- Companies in asset-heavy industries (like manufacturing or utilities) might naturally have lower ROA than those in service-based industries.
d) Return on Equity (ROE)
Return on Equity (ROE) measures the profit a company generates for each dollar of shareholders’ equity. It’s a key ratio for investors, as it shows how effectively the company is using the money invested by its shareholders to generate profits.
-
Formula:
Return on Equity (ROE) = (Net Income / Shareholder Equity) * 100% -
What it means: It tells you how much profit a company is making for every dollar of equity invested by its owners.
-
Interpretation:
- A higher ROE is generally preferred, as it means the company is generating more profit with the money shareholders have invested.
- However, a very high ROE might sometimes indicate high financial leverage (debt), which can be risky. It’s often analyzed alongside solvency ratios.
3. Decoding Solvency Ratios: Can We Pay Our Debts Long-Term?
While liquidity focuses on short-term obligations, solvency refers to a company’s ability to meet its long-term financial obligations. This means having enough assets and cash flow to cover debts that extend beyond one year, like long-term loans or bonds. A solvent company is one that can stay in business for the foreseeable future without defaulting on its debts.
Key Solvency Ratios:
a) Debt-to-Equity Ratio
The Debt-to-Equity Ratio compares a company’s total debt to its shareholder equity. It shows how much debt a company is using to finance its assets relative to the value of shareholders’ equity.
-
Formula:
Debt-to-Equity Ratio = Total Debt / Shareholder Equity -
What it means: It’s a key indicator of financial leverage. Companies with a high debt-to-equity ratio are considered more risky because they rely heavily on debt financing.
-
Interpretation:
- A ratio of 1:1 means the company is financed equally by debt and equity.
- A ratio greater than 1:1 suggests the company relies more on debt than equity, potentially indicating higher financial risk.
- A lower ratio is generally preferred by investors and creditors, as it means the company is less reliant on borrowed money.
- Acceptable debt levels vary significantly by industry. Utilities, for example, often have higher debt ratios due to stable cash flows.
b) Debt-to-Asset Ratio
The Debt-to-Asset Ratio indicates the percentage of a company’s total assets that are financed by debt.
-
Formula:
Debt-to-Asset Ratio = Total Debt / Total Assets -
What it means: This ratio gives a broader picture of a company’s overall debt burden relative to its entire asset base.
-
Interpretation:
- A ratio of 0.5 (or 50%) means half of the company’s assets are financed by debt.
- A higher ratio indicates greater financial risk, as a larger proportion of the company’s assets are funded by creditors.
- A lower ratio means the company is more conservative in its financing, relying less on borrowing.
c) Interest Coverage Ratio (Times Interest Earned)
The Interest Coverage Ratio measures a company’s ability to pay its interest expenses on outstanding debt. It essentially tells you how many times a company can cover its interest payments with its earnings before interest and taxes (EBIT).
-
Formula:
Interest Coverage Ratio = Earnings Before Interest & Taxes (EBIT) / Interest Expense -
What it means: This ratio is crucial for creditors, as it indicates the risk of a company defaulting on its interest payments.
-
Interpretation:
- A ratio of 1.5 or 2 or higher is generally considered healthy, suggesting the company can comfortably meet its interest obligations.
- A ratio below 1 means the company’s earnings aren’t even enough to cover its interest payments, which is a serious red flag.
- A higher ratio indicates a stronger ability to service debt.
Beyond the Numbers: Context is King
While these ratios are incredibly powerful, remember that they are just numbers. To truly decode a company’s financial health, you must consider them within a broader context:
- Industry Benchmarks: A "good" ratio in one industry might be "bad" in another. Compare companies only within the same industry.
- Trend Analysis: Look at how ratios change over several periods (e.g., 3-5 years). Are they improving, deteriorating, or stable?
- Qualitative Factors: Ratios don’t tell the whole story. Consider factors like:
- Management quality and experience.
- Economic conditions and outlook.
- Competitive landscape.
- New products or innovations.
- Regulatory environment.
- Brand strength.
- Limitations: Ratios are based on historical data and can be manipulated through accounting practices. They also don’t account for non-financial assets or future prospects.
- Data Source: Always ensure you’re using reliable, audited financial statements.
Conclusion: Your Journey to Financial Literacy Begins Now
Understanding financial ratios might seem daunting at first, but like any new language, it becomes clearer with practice. By focusing on liquidity, profitability, and solvency, you gain fundamental insights into a company’s immediate health, its ability to generate income, and its long-term stability.
These ratios are not just for seasoned financial analysts; they are for anyone who wants to make informed decisions – whether it’s about investing in a stock, lending money to a business, or even understanding your own company’s performance. Start by picking a company you know or are interested in, find its financial statements (often available on their investor relations website), and calculate a few of these ratios. You’ll be amazed at the story the numbers begin to tell.
Your journey to decoding financial ratios has just begun. Embrace the numbers, and empower yourself with the knowledge to see beyond the surface of financial data.


Post Comment