Consumer Surplus vs. Producer Surplus: Maximizing Economic Welfare & Market Efficiency
Have you ever walked away from a purchase feeling like you got an amazing deal? Or perhaps, as a seller, you managed to sell something for much more than you expected? These feelings of "extra gain" are at the heart of two fundamental concepts in economics: Consumer Surplus and Producer Surplus.
Understanding these concepts isn’t just for economists; it’s crucial for anyone wanting to grasp how markets truly function, why certain policies are implemented, and how society strives to maximize its overall well-being, or "welfare." In this comprehensive guide, we’ll break down consumer surplus, producer surplus, and reveal how their interplay leads to the most efficient allocation of resources possible.
What is Consumer Surplus? The Buyer’s "Happy Deal"
Imagine you’re craving a specific book. You’d be willing to pay up to $30 for it because you really want to read it. You walk into the bookstore, and to your delight, the book is priced at only $20. You buy it, feeling like you just saved $10! That $10 is your Consumer Surplus.
Definition: Consumer surplus is the difference between the maximum price a consumer is willing to pay for a good or service and the actual price they pay. It represents the benefit or extra value that consumers receive from purchasing a product at a price lower than their maximum willingness to pay.
Key Characteristics of Consumer Surplus:
- Individual Benefit: It’s a measure of the individual gain experienced by a specific buyer.
- Willingness to Pay (WTP): This is the highest price a consumer is prepared to pay for a good. It reflects the value they place on that good.
- Market Price: The actual price at which the good is sold in the market.
- Calculation: Consumer Surplus = Willingness to Pay – Actual Market Price.
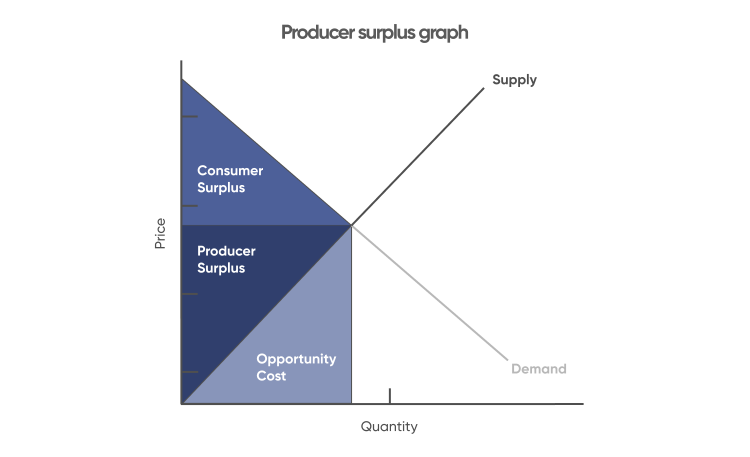
- Graphical Representation: On a standard supply and demand graph, consumer surplus is the area below the demand curve and above the market price. The demand curve itself represents the willingness to pay of different consumers at various quantities.
Example:
Let’s say the demand for a new video game console looks like this:
- Player A is willing to pay $600.
- Player B is willing to pay $550.
- Player C is willing to pay $500.
- Player D is willing to pay $450.
If the market price for the console is $500:
- Player A’s surplus: $600 (WTP) – $500 (Price) = $100
- Player B’s surplus: $550 (WTP) – $500 (Price) = $50
- Player C’s surplus: $500 (WTP) – $500 (Price) = $0 (They still buy it, but gain no extra "surplus")
- Player D will not buy the console as their WTP ($450) is less than the market price.
The total consumer surplus in this small market would be $100 + $50 = $150.
What is Producer Surplus? The Seller’s "Bonus"
Now, let’s flip the coin. Imagine you’re a baker who makes delicious cookies. You’ve calculated that it costs you $1 to make each cookie (ingredients, labor, electricity, etc.). You’d be willing to sell them for as little as $1.25 just to cover your costs and make a tiny profit. However, your cookies are so popular that you manage to sell them for $2 each. That extra $0.75 you get above your minimum acceptable price is your Producer Surplus.
Definition: Producer surplus is the difference between the actual price a producer receives for a good or service and the minimum price they would have been willing to accept (which often reflects their cost of production). It represents the benefit or extra profit that producers gain from selling a product at a price higher than their minimum acceptable price.
Key Characteristics of Producer Surplus:
- Individual Benefit: It’s a measure of the individual gain experienced by a specific seller.
- Cost of Production/Willingness to Sell (WTS): This is the lowest price a producer is prepared to accept for a good, covering their costs.
- Market Price: The actual price at which the good is sold in the market.
- Calculation: Producer Surplus = Actual Market Price – Willingness to Sell (Cost of Production).
- Graphical Representation: On a standard supply and demand graph, producer surplus is the area above the supply curve and below the market price. The supply curve itself represents the costs of production for different producers at various quantities.
Example:
Consider the supply of handmade scarves:
- Artisan A can make a scarf for $15.
- Artisan B can make a scarf for $20.
- Artisan C can make a scarf for $25.
- Artisan D can make a scarf for $30.
If the market price for scarves is $25:
- Artisan A’s surplus: $25 (Price) – $15 (Cost) = $10
- Artisan B’s surplus: $25 (Price) – $20 (Cost) = $5
- Artisan C’s surplus: $25 (Price) – $25 (Cost) = $0 (They still sell it, but gain no extra "surplus")
- Artisan D will not sell the scarf as their cost ($30) is higher than the market price.
The total producer surplus in this small market would be $10 + $5 = $15.
Bringing Them Together: The Magic of Market Equilibrium
Consumer surplus and producer surplus are not isolated concepts; they are two sides of the same market coin. They converge at the market equilibrium, where the forces of supply and demand meet.
Market Equilibrium: This is the point where the quantity of a good that consumers are willing and able to buy exactly matches the quantity that producers are willing and able to sell. At this point, the market price is stable, and there are no shortages or surpluses.
- Graphically: The equilibrium is where the demand curve intersects the supply curve. The price at this intersection is the equilibrium price, and the quantity is the equilibrium quantity.
At the equilibrium price and quantity, something remarkable happens:
- Consumer Surplus: All consumers who are willing to pay a price equal to or above the equilibrium price will purchase the good and experience some level of consumer surplus. This forms a triangle above the equilibrium price and below the demand curve.
- Producer Surplus: All producers who are willing to sell at a price equal to or below the equilibrium price will sell the good and experience some level of producer surplus. This forms a triangle below the equilibrium price and above the supply curve.
Maximizing Welfare: The Power of Equilibrium
The true beauty of consumer and producer surplus lies in their combined power to illustrate economic welfare (also known as social welfare or total surplus).
Total Welfare = Consumer Surplus + Producer Surplus
Economic welfare represents the total benefit that society receives from the production and consumption of a good. A fundamental principle in economics is that a free, competitive market operating at its equilibrium point maximizes total welfare.
Why Equilibrium Maximizes Welfare:
- Optimal Allocation: At equilibrium, goods are produced by the sellers with the lowest costs and consumed by the buyers who value them most highly. There’s no way to reallocate production or consumption to make someone better off without making someone else worse off. This is often referred to as Pareto efficiency.
- No Unexploited Gains: If the market were to produce less than the equilibrium quantity, there would be potential buyers willing to pay more than the cost of production for additional units, leaving "gains from trade" unexploited.
- No Wasteful Production: If the market were to produce more than the equilibrium quantity, the cost of producing the extra units would exceed the value consumers place on them, leading to inefficient and wasteful production.
- Absence of Deadweight Loss: When a market operates at its equilibrium, there is no deadweight loss. Deadweight loss is the reduction in total surplus (both consumer and producer) that results from an inefficient allocation of resources. It’s the "lost" welfare that could have been achieved but wasn’t, often due to market distortions or government interventions.
In essence, the market equilibrium is the "sweet spot" where the gains to buyers and sellers are perfectly balanced, leading to the largest possible pie of benefits for society as a whole.
Real-World Examples & Implications
Understanding consumer and producer surplus helps us analyze various economic phenomena and government policies:
- Government Intervention (Taxes & Subsidies):
- Taxes: When the government imposes a tax on a good, the price usually rises for consumers and falls for producers (after the tax). This shrinks both consumer and producer surplus, creating a deadweight loss. The deadweight loss represents the economic inefficiency caused by the tax, as some mutually beneficial transactions no longer occur.
- Subsidies: A subsidy (a payment from the government to producers or consumers) can lower the price for consumers and raise the effective price for producers. While this increases both consumer and producer surplus, it can also lead to overproduction and potential inefficiencies if the cost of the subsidy outweighs the societal benefit, again creating deadweight loss.
- Price Controls (Ceilings & Floors):
- Price Ceiling (Maximum Price): If a government sets a maximum price below the equilibrium price (e.g., rent control), it helps some consumers who get the good cheaper, increasing their surplus. However, it reduces producer surplus significantly and often leads to shortages, excluding other consumers and creating a substantial deadweight loss.
- Price Floor (Minimum Price): If a government sets a minimum price above the equilibrium price (e.g., minimum wage for labor, agricultural price supports), it helps some producers who sell at a higher price, increasing their surplus. However, it reduces consumer surplus and often leads to surpluses (e.g., unemployment for labor), excluding other producers and creating deadweight loss.
- Technological Advancements: When technology improves, it typically lowers the cost of production. This shifts the supply curve to the right, leading to a lower equilibrium price and a higher equilibrium quantity. The result is often an increase in both consumer surplus (consumers pay less) and producer surplus (producers sell more efficiently).
- Competition: A highly competitive market tends to drive prices down towards the cost of production, increasing consumer surplus. While this might seem to squeeze producer surplus per unit, the increased volume of sales can still lead to healthy overall producer surplus, and the efficiency gains benefit society.
- Innovation: New products or services can create entirely new markets, generating significant consumer surplus for early adopters and substantial producer surplus for the innovators.
Why Does This Matter?
Understanding consumer and producer surplus isn’t just an academic exercise; it has profound real-world implications:
- For Policymakers: Governments use these concepts to evaluate the potential impact of taxes, subsidies, regulations, and trade policies. Their goal is often to maximize social welfare, or at least minimize deadweight loss, when intervening in markets.
- For Businesses: Companies can better understand their market position and pricing strategies. For example, a business might aim to capture more consumer surplus through effective marketing and branding, or reduce costs to increase their producer surplus.
- For Consumers: Knowing these concepts helps individuals understand the "value for money" they receive and the broader economic consequences of market forces and government actions.
Conclusion: The Harmony of the Market
Consumer surplus and producer surplus are powerful tools for understanding the efficiency of markets and the distribution of economic benefits. They demonstrate that when buyers and sellers interact freely in a competitive market, they naturally gravitate towards an equilibrium that maximizes the total welfare for society.
While government intervention may sometimes be necessary to address market failures or achieve specific social goals, a clear understanding of consumer and producer surplus helps us recognize the trade-offs involved and the potential for unintended consequences, particularly the creation of deadweight loss. By striving for market conditions that foster healthy consumer and producer surplus, we pave the way for a more efficient and prosperous economy for everyone.


Post Comment