Break-Even Analysis: Determining Your Profitability Threshold
Every entrepreneur dreams of success, of growing their business, and most importantly, of making a profit. But before you can fill your coffers, you need to understand a critical concept: Break-Even Analysis. This powerful financial tool helps you pinpoint the exact moment your business starts to turn a profit, moving from covering costs to generating income.
Think of it as your business’s financial launchpad. Knowing your break-even point allows you to set realistic goals, make informed decisions, and navigate the often-turbulent waters of business ownership with greater confidence.
In this comprehensive guide, we’ll demystify Break-Even Analysis, explain its core components, show you how to calculate it, and illustrate why it’s an indispensable tool for businesses of all sizes, from startups to established enterprises.
What Exactly is Break-Even Analysis?
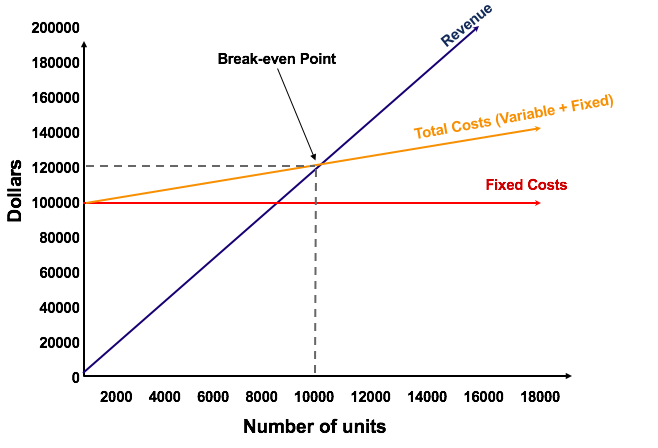
At its heart, Break-Even Analysis is a calculation that determines the point at which your total costs and total revenues are equal. In simpler terms, it’s the point where your business isn’t losing money, but it’s not yet making a profit either. You’ve simply covered all your expenses.
This crucial point is known as the Break-Even Point (BEP). Once you sell a single unit beyond this point, you begin to generate profit. It’s your profitability threshold – the line in the sand between operating at a loss and operating at a gain.
Why is this important? Imagine trying to drive a car without a speedometer or fuel gauge. You wouldn’t know how fast you’re going or when you’re about to run out of gas. Break-Even Analysis provides that essential dashboard for your business, telling you how much you need to sell just to keep the lights on, let alone thrive.
The Essential Ingredients: Understanding Your Costs
To calculate your break-even point, you first need to understand and categorize your business expenses. Costs generally fall into two main categories: Fixed Costs and Variable Costs.
1. Fixed Costs
Fixed costs are expenses that do not change, regardless of how much product or service you produce or sell. They are constant within a relevant range of activity and time. Even if you sell zero units, you still incur these costs.
Examples of Fixed Costs include:
- Rent for your office, store, or factory: You pay this monthly, whether you sell one item or a thousand.
- Salaries of administrative staff: Employees like your receptionist, accountant, or managers often receive a fixed salary regardless of sales volume.
- Insurance premiums: Business insurance is a regular, non-negotiable expense.
- Depreciation on equipment: The cost of your machinery or vehicles is expensed over time.
- Loan payments: If you have business loans, the monthly payments are typically fixed.
- Software subscriptions: Many businesses rely on software (CRM, accounting, project management) with fixed monthly or annual fees.
2. Variable Costs
Variable costs are expenses that fluctuate directly with the volume of goods or services your business produces or sells. The more you produce, the higher your total variable costs will be.
Examples of Variable Costs include:
- Raw materials: If you make physical products, the cost of the materials used in each unit is a variable cost.
- Direct labor wages: The wages paid to employees directly involved in producing each unit (e.g., assembly line workers).
- Production supplies: Consumables used in the manufacturing process that vary with output.
- Sales commissions: If your sales team earns a percentage of each sale, this is a variable cost.
- Packaging and shipping costs: These costs increase with each unit sold and delivered.
- Transaction fees: Credit card processing fees are often a percentage of each sale.
Why the distinction matters: Understanding the difference between fixed and variable costs is fundamental to financial planning and, specifically, to calculating your break-even point. Fixed costs are covered by the "contribution margin" from each sale, while variable costs are deducted before calculating that margin.
The Magic Number: Contribution Margin
Before we dive into the formula, let’s talk about the Contribution Margin. This is a crucial concept in break-even analysis.
The Contribution Margin per Unit is the amount of revenue left from each sale after covering the variable costs associated with that sale. This leftover amount is then used to cover your fixed costs. Once all fixed costs are covered, the remaining contribution margin becomes your profit.
Formula for Contribution Margin per Unit:
Contribution Margin per Unit = Selling Price Per Unit – Variable Cost Per Unit
Example:
- You sell a handmade bracelet for $20.
- The raw materials (beads, wire, clasp) cost you $5.
- The labor to make it costs $3.
- Your Variable Cost Per Unit = $5 (materials) + $3 (labor) = $8.
- Contribution Margin Per Unit = $20 (Selling Price) – $8 (Variable Cost) = $12.
This means that for every bracelet you sell, $12 is available to contribute towards covering your fixed costs and, eventually, generating profit.
The Break-Even Formula: Putting It All Together
Now that you understand your costs and the contribution margin, we can put it all together to calculate your break-even point. There are two primary ways to express the break-even point: in units and in sales dollars.
1. Break-Even Point in Units
This calculation tells you how many individual products or services you need to sell to cover all your costs.
Formula:
Break-Even Point (Units) = Total Fixed Costs / (Selling Price Per Unit – Variable Cost Per Unit)
Or, more simply:
Break-Even Point (Units) = Total Fixed Costs / Contribution Margin Per Unit
Let’s use an example:
Imagine "Sweet Treats Bakery" wants to determine how many cupcakes they need to sell each month to break even.
Knowns:
- Monthly Fixed Costs:
- Rent: $1,000
- Baker’s Salary: $2,500
- Utilities: $300
- Insurance: $200
- Total Fixed Costs = $1,000 + $2,500 + $300 + $200 = $4,000
- Selling Price Per Cupcake: $4.00
- Variable Cost Per Cupcake:
- Ingredients: $0.75
- Packaging: $0.25
- Total Variable Cost Per Cupcake = $0.75 + $0.25 = $1.00
Calculation:
- Calculate Contribution Margin Per Cupcake:
$4.00 (Selling Price) – $1.00 (Variable Cost) = $3.00 - Calculate Break-Even Point in Units:
$4,000 (Total Fixed Costs) / $3.00 (Contribution Margin Per Cupcake) = 1,333.33 units
Conclusion: Sweet Treats Bakery needs to sell approximately 1,334 cupcakes each month to cover all their fixed and variable costs. Selling 1,333 cupcakes would leave them just short of breaking even, so rounding up is important.
2. Break-Even Point in Sales Dollars
This calculation tells you the total sales revenue your business needs to generate to cover all its costs. This is particularly useful if your business sells multiple products at different price points, or if you prefer to think in terms of overall revenue targets.
To calculate this, we often use the Contribution Margin Ratio.
Contribution Margin Ratio = (Selling Price Per Unit – Variable Cost Per Unit) / Selling Price Per Unit
Or, more simply:
Contribution Margin Ratio = Contribution Margin Per Unit / Selling Price Per Unit
This ratio represents the percentage of each sales dollar that is available to cover fixed costs and contribute to profit.
Formula for Break-Even Point (Sales Dollars):
Break-Even Point (Sales Dollars) = Total Fixed Costs / Contribution Margin Ratio
Let’s continue with Sweet Treats Bakery:
Knowns:
- Total Fixed Costs: $4,000
- Selling Price Per Cupcake: $4.00
- Variable Cost Per Cupcake: $1.00
- Contribution Margin Per Cupcake: $3.00
Calculation:
- Calculate Contribution Margin Ratio:
$3.00 (Contribution Margin Per Cupcake) / $4.00 (Selling Price Per Cupcake) = 0.75 or 75%
This means that for every dollar of sales, 75 cents is available to cover fixed costs. - Calculate Break-Even Point in Sales Dollars:
$4,000 (Total Fixed Costs) / 0.75 (Contribution Margin Ratio) = $5,333.33
Conclusion: Sweet Treats Bakery needs to generate $5,333.33 in sales revenue each month to cover all their costs.
(You can verify this by multiplying the break-even units by the selling price: 1,333.33 units $4.00/unit = $5,333.32. The slight difference is due to rounding.)*
Why Break-Even Analysis is Indispensable for Your Business
Knowing your break-even point is far more than just a theoretical exercise. It’s a foundational piece of financial intelligence that empowers you to make strategic decisions across your entire business.
Here’s why it’s so important:
-
Pricing Strategy:
- Helps you determine if your current prices are sustainable.
- Informs decisions about price adjustments. If your break-even point is too high, you might need to raise prices or lower costs.
-
Budgeting and Financial Planning:
- Provides a baseline for your sales targets. You know the minimum sales volume required before you even think about profit.
- Aids in creating realistic budgets for both expenses and revenue.
-
Risk Assessment:
- Reveals the level of sales risk associated with your business model. A high break-even point means you need significant sales volume to avoid losses, indicating higher risk.
- Helps identify areas where cost reductions could significantly lower your break-even point.
-
Decision Making for New Products or Services:
- Before launching a new product, you can perform a break-even analysis to see if it’s financially viable at projected sales volumes and costs.
- Helps decide whether to expand operations, open new locations, or invest in new equipment.
-
Setting Sales Goals:
- Provides a clear, tangible sales target for your team. It’s easier to motivate when everyone knows the minimum goal to achieve profitability.
- Allows you to set profit targets (e.g., "We want $X profit, so we need to sell Y units beyond break-even").
-
Securing Funding:
- Investors and lenders often want to see a clear understanding of your business’s financial viability. A well-presented break-even analysis demonstrates financial literacy and a clear path to profitability.
- It shows them you’ve done your homework and understand the financial implications of your business model.
-
Cost Control:
- By dissecting your fixed and variable costs, you can identify areas where you might be able to reduce expenses and thus lower your break-even point.
- Are your raw material costs too high? Can you negotiate better rent?
Practical Tips for Conducting Your Break-Even Analysis
While the formulas are straightforward, getting accurate results requires careful attention to your business’s financial details.
- Be Accurate with Your Costs: This is the most critical step. Go through your financial records meticulously to identify all fixed and variable costs. Don’t guess!
- Review Regularly: Your costs, prices, and market conditions can change. Conduct a break-even analysis at least annually, or whenever there are significant changes to your business (e.g., price increases, new product launches, changes in rent).
- Consider Different Scenarios (What-If Analysis):
- What if you increase your selling price by 10%?
- What if your raw material costs go up by 5%?
- What if you invest in new equipment that lowers variable costs but increases fixed costs?
- Running these "what-if" scenarios helps you understand the sensitivity of your break-even point to various factors.
- Use Technology: Spreadsheets (like Excel or Google Sheets) are excellent tools for building a dynamic break-even model. Many accounting software solutions also offer features to help with this.
- Seek Professional Advice: If you’re struggling to categorize costs or feel unsure about your calculations, consult with an accountant or a business financial advisor. They can provide valuable insights and ensure accuracy.
- Don’t Forget Sales Volume: While break-even tells you how much you need to sell, remember to also consider how much you can sell. Is your break-even point achievable given market demand and your production capacity?
Common Pitfalls to Avoid
Even with the right formulas, it’s easy to make mistakes that can skew your break-even analysis.
- Misclassifying Costs: Incorrectly categorizing a variable cost as fixed, or vice-versa, will lead to inaccurate results. Double-check your cost allocations.
- Ignoring Volume Discounts/Scalability: Your variable costs might decrease per unit as you buy materials in larger quantities. Your fixed costs might jump at certain thresholds (e.g., needing a second factory once production hits a certain level). A static analysis might miss these nuances.
- One-Time Costs: Don’t include one-time startup costs (like purchasing initial equipment) in your ongoing fixed costs unless they are part of a regular expense (like a lease payment).
- Forgetting About Market Demand: Just because you can break even at a certain sales volume doesn’t mean there’s enough demand in the market to achieve that volume. Always pair your financial analysis with market research.
- Static Analysis: The business environment is dynamic. Don’t calculate your break-even point once and forget about it. It’s a living metric that needs regular review.
Conclusion
Break-Even Analysis is more than just a financial calculation; it’s a fundamental pillar of smart business management. By clearly understanding your fixed and variable costs, calculating your contribution margin, and determining your break-even point, you gain invaluable insights into your business’s financial health and potential.
It empowers you to set realistic goals, make informed pricing decisions, assess risks, and confidently plan for growth. Whether you’re launching a new venture or steering an established company, mastering break-even analysis is a crucial step towards achieving sustainable profitability and long-term success.
Start calculating your break-even point today – it’s the first step towards understanding your profitability threshold and building a truly successful business.


Post Comment