Mastering Financial Statements: A Beginner’s Guide to P&L, Balance Sheet, and Cash Flow
In the world of business, numbers tell a story. But for many, especially beginners, these numbers can feel like a foreign language, a complex code that only financial wizards can decipher. If terms like P&L, Balance Sheet, and Cash Flow Statement send a shiver down your spine, you’re not alone.
However, understanding these core financial statements is not just for accountants or investors; it’s a vital skill for anyone looking to run a successful business, evaluate an investment, or even just manage personal finances more effectively. They are the backbone of financial literacy, offering crucial insights into a company’s health, performance, and potential.
This comprehensive guide will demystify the "Big Three" financial statements, breaking down their components, explaining what they tell you, and showing how they work together to paint a complete picture of a company’s financial journey. Get ready to transform from a financial novice to a confident interpreter of business numbers!
Why Bother? The Importance of Understanding Financial Statements
Before we dive into the specifics, let’s establish why these documents matter so much:
- For Business Owners & Entrepreneurs:
- Performance Tracking: Are you making a profit? Are your sales growing?
- Decision Making: Should you expand? Cut costs? Invest in new equipment?
- Resource Management: Do you have enough cash to pay bills? Are you carrying too much debt?
- Strategic Planning: Where is the business headed? What adjustments are needed?
- Attracting Funding: Investors and lenders require these statements to assess risk and potential returns.
- For Investors:
- Company Valuation: Is the company a good investment? Is it undervalued or overvalued?
- Risk Assessment: How stable is the company financially? Can it withstand economic downturns?
- Growth Potential: Is the company growing its revenue and profits sustainably?
- For Employees & Job Seekers:
- Company Stability: Is your employer financially sound?
- Career Opportunities: Understanding the company’s financial health can inform your career decisions.
- For Everyone Else:
- Economic Literacy: Better understanding of how businesses and the economy function.
- Personal Finance Skills: The principles learned can often be applied to managing your own money.
In essence, financial statements are the GPS for any business. They tell you where you’ve been, where you are, and help you chart a course for where you want to go.
1. The Profit & Loss Statement (P&L) / Income Statement
Analogy: Think of the P&L as a movie of your company’s financial performance over a specific period (e.g., a quarter, a year). It shows you if you made money or lost money during that time.
The P&L statement, also known as the Income Statement, is arguably the most watched financial document. It summarizes a company’s revenues, costs, and expenses over a specific period, typically a month, quarter, or year. The "bottom line" of the P&L is Net Income (or Net Loss), which tells you how much profit (or loss) the company generated.
Key Components of a P&L Statement:
Let’s break down the typical flow, from the "top line" to the "bottom line":
- Revenue (or Sales):
- What it is: The total amount of money a company earns from its primary operations (selling goods or services). This is the "top line."
- Example: A clothing store’s revenue is the total money it collects from selling clothes.
- Cost of Goods Sold (COGS):
- What it is: The direct costs attributable to the production of the goods or services sold by a company. This includes the cost of materials and direct labor.
- Example: For the clothing store, COGS would be the cost of purchasing the clothes from the manufacturer.
- Gross Profit:
- Formula: Revenue – Cost of Goods Sold = Gross Profit
- What it is: The profit a company makes after deducting the direct costs associated with making and selling its products, before factoring in other operating expenses. It shows how efficiently the company is producing its core product.
- Operating Expenses:
- What they are: Costs not directly tied to production but necessary for running the business. These are often grouped into:
- Selling, General & Administrative (SG&A): Salaries (non-production), rent, utilities, marketing, office supplies, insurance.
- Research & Development (R&D): Costs associated with developing new products or improving existing ones.
- Example: The clothing store’s rent, advertising costs, and sales associates’ salaries.
- What they are: Costs not directly tied to production but necessary for running the business. These are often grouped into:
- Operating Income (or EBIT – Earnings Before Interest & Taxes):
- Formula: Gross Profit – Operating Expenses = Operating Income
- What it is: The profit generated from a company’s core operations, before accounting for interest payments and taxes. It shows how profitable the company is from its primary business activities.
- Interest Expense:
- What it is: The cost of borrowing money (e.g., interest on loans).
- Taxes:
- What it is: The amount of income tax the company owes to the government.
- Net Income (or The Bottom Line):
- Formula: Operating Income – Interest Expense – Taxes = Net Income
- What it is: The final profit remaining after all expenses, including interest and taxes, have been deducted from revenue. This is the ultimate measure of a company’s profitability for the period. If it’s negative, it’s a Net Loss.
What the P&L Tells You:
- Profitability: Is the company making money? How much?
- Efficiency: How effectively is it managing its costs (COGS, operating expenses) relative to its sales?
- Growth: Is revenue increasing over time?
- Trends: Are certain expenses growing faster than revenue?
Example Simplified P&L:
| Item | Amount ($) |
|---|---|
| Revenue | 100,000 |
| Less: Cost of Goods Sold | (40,000) |
| Gross Profit | 60,000 |
| Less: Operating Expenses | |
| – Salaries | (20,000) |
| – Rent | (5,000) |
| – Marketing | (3,000) |
| Operating Income | 32,000 |
| Less: Interest Expense | (2,000) |
| Less: Taxes | (8,000) |
| Net Income | 22,000 |
2. The Balance Sheet
Analogy: If the P&L is a movie, the Balance Sheet is a photograph. It captures a company’s financial position at a specific point in time (e.g., December 31st, 2023). It shows what a company owns (assets), what it owes (liabilities), and what is left over for the owners (equity).
The Balance Sheet gets its name from its fundamental accounting equation, which must always "balance":
Assets = Liabilities + Owner’s Equity
This equation represents that everything a company owns (assets) must have been financed either by borrowing money (liabilities) or by the owners’ investment (equity).
Key Components of a Balance Sheet:
A. Assets (What the Company Owns)
Assets are resources controlled by the company that are expected to provide future economic benefits. They are typically listed in order of liquidity (how easily they can be converted to cash).
- Current Assets:
- What they are: Assets that can be converted into cash within one year.
- Examples:
- Cash & Cash Equivalents: Actual money in the bank, short-term investments.
- Accounts Receivable (A/R): Money owed to the company by its customers for goods/services already delivered.
- Inventory: Raw materials, work-in-progress, and finished goods ready for sale.
- Prepaid Expenses: Payments made for future expenses (e.g., rent paid in advance).
- Non-Current Assets (or Long-Term Assets):
- What they are: Assets that are not expected to be converted into cash within one year.
- Examples:
- Property, Plant & Equipment (PP&E): Land, buildings, machinery, vehicles. These are often listed net of depreciation.
- Intangible Assets: Non-physical assets like patents, trademarks, copyrights, goodwill (the value of a company’s brand or reputation).
B. Liabilities (What the Company Owes)
Liabilities are obligations a company owes to outside parties. They represent claims against the company’s assets.
- Current Liabilities:
- What they are: Debts or obligations due within one year.
- Examples:
- Accounts Payable (A/P): Money the company owes to its suppliers for goods/services received.
- Short-Term Debt: Loans or lines of credit due within a year.
- Accrued Expenses: Expenses incurred but not yet paid (e.g., salaries owed to employees).
- Unearned Revenue: Money received from customers for goods/services not yet delivered.
- Non-Current Liabilities (or Long-Term Liabilities):
- What they are: Debts or obligations due in more than one year.
- Examples:
- Long-Term Debt: Bank loans, bonds payable due in more than a year.
- Deferred Tax Liabilities: Taxes that are owed but not yet due.
C. Owner’s Equity (or Shareholder’s Equity) (What’s Left for the Owners)
Equity represents the owners’ residual claim on the company’s assets after all liabilities have been paid. It’s the "book value" of the company.
- Common Stock / Contributed Capital:
- What it is: The money owners (shareholders) initially invested in the company.
- Retained Earnings:
- What it is: The cumulative total of all net income the company has earned since its inception, minus any dividends paid out to shareholders. This is the link between the P&L and the Balance Sheet!
What the Balance Sheet Tells You:
- Financial Health: The overall stability and solvency of the company.
- Asset Structure: How much the company owns and what type of assets it has.
- Debt Levels: How much debt the company has relative to its assets and equity.
- Capital Structure: How the company is financed (debt vs. equity).
- Liquidity: The company’s ability to meet its short-term obligations (current assets vs. current liabilities).
Example Simplified Balance Sheet (as of Dec 31, 2023):
| Assets | Amount ($) | Liabilities & Equity | Amount ($) |
|---|---|---|---|
| Current Assets | Current Liabilities | ||
| Cash | 20,000 | Accounts Payable | 10,000 |
| Accounts Receivable | 15,000 | Short-Term Debt | 5,000 |
| Inventory | 25,000 | Total Current Liab. | 15,000 |
| Total Current Assets | 60,000 | ||
| Long-Term Liabilities | |||
| Non-Current Assets | Long-Term Debt | 30,000 | |
| Property & Equipment | 80,000 | Total Long-Term Liab. | 30,000 |
| TOTAL ASSETS | 140,000 | TOTAL LIABILITIES | 45,000 |
| Owner’s Equity | |||
| Common Stock | 50,000 | ||
| Retained Earnings | 45,000 | ||
| TOTAL EQUITY | 95,000 | ||
| TOTAL LIAB. & EQUITY | 140,000 |
Notice how Total Assets ($140,000) equals Total Liabilities & Equity ($140,000). It balances!
3. The Cash Flow Statement
Analogy: Imagine your personal bank statement. It shows every dollar that came in and every dollar that went out. The Cash Flow Statement is exactly that for a business. It’s the most transparent view of a company’s liquidity.
While the P&L shows profitability and the Balance Sheet shows assets and liabilities, neither directly tells you if a company has enough cash to pay its bills. A company can be profitable on paper (high Net Income) but still run out of cash if, for example, its customers aren’t paying quickly or it’s investing heavily. This is why the Cash Flow Statement is so crucial.
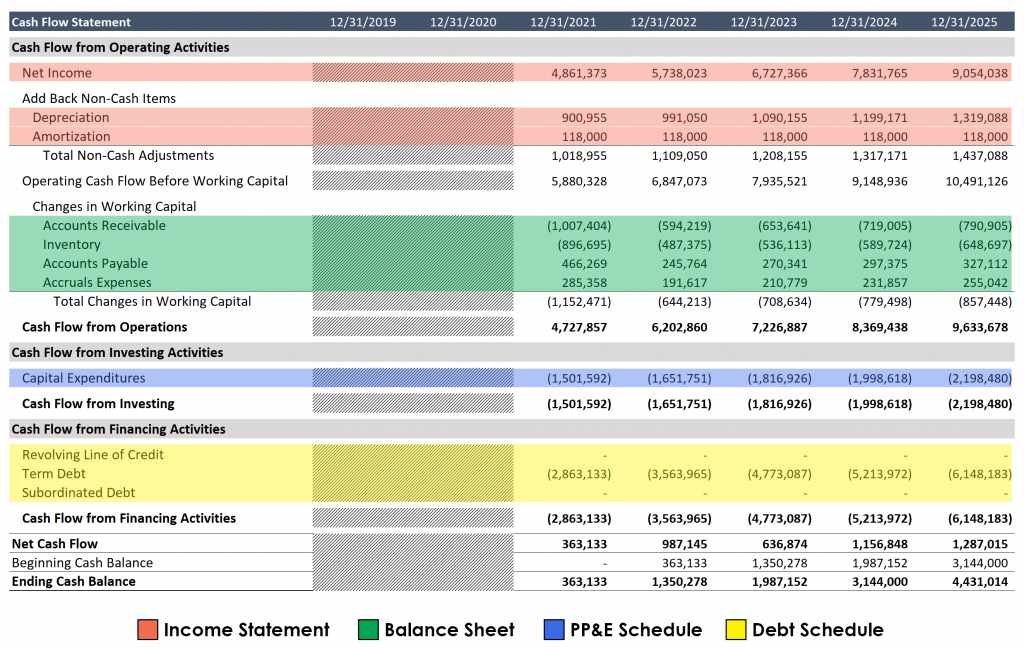
The Cash Flow Statement categorizes all cash inflows (money coming in) and cash outflows (money going out) into three main activities:
Three Sections of the Cash Flow Statement:
A. Cash Flow from Operating Activities (CFO)
- What it is: Cash generated or used by a company’s core, day-to-day business operations. This is often seen as the most important section as it reflects the company’s ability to generate cash from its main revenue-producing activities.
- How it’s calculated: Starts with Net Income from the P&L and then adjusts for non-cash items (like depreciation) and changes in working capital (like accounts receivable, inventory, and accounts payable).
- Examples:
- Inflows: Cash from customers for sales, cash from royalties, interest received.
- Outflows: Cash paid to suppliers, employees, for rent, utilities, and taxes.
B. Cash Flow from Investing Activities (CFI)
- What it is: Cash generated or used from the purchase or sale of long-term assets, investments, and other non-operating assets.
- Examples:
- Inflows: Cash from selling property, plant, and equipment (PP&E); cash from selling investments in other companies.
- Outflows: Cash used to purchase PP&E (e.g., new machinery, buildings); cash used to buy investments in other companies.
C. Cash Flow from Financing Activities (CFF)
- What it is: Cash generated or used from activities related to debt, equity, and dividends. This section reflects how a company raises capital and how it repays its investors.
- Examples:
- Inflows: Cash from issuing new stock, cash from taking out new loans.
- Outflows: Cash paid back to lenders (loan principal payments), cash paid to shareholders as dividends, cash used to repurchase its own stock.
What the Cash Flow Statement Tells You:
- Liquidity: Does the company have enough cash on hand to meet its short-term obligations?
- Solvency: Can it generate enough cash to pay its debts?
- Funding Sources: How is the company financing its operations and growth? (Are they relying on debt, equity, or internal cash generation?)
- Quality of Earnings: A company with strong operating cash flow often has higher quality earnings than one that relies heavily on non-cash adjustments.
- Investment & Debt Strategy: How much is the company investing in its future (new assets) and how is it managing its debt and shareholder returns?
Example Simplified Cash Flow Statement (for the year ended Dec 31, 2023):
| Item | Amount ($) |
|---|---|
| Cash Flow from Operating Activities | |
| Net Income | 22,000 |
| Add back: Depreciation (non-cash) | 5,000 |
| Change in Accounts Receivable | (3,000) |
| Change in Inventory | (2,000) |
| Change in Accounts Payable | 4,000 |
| Net Cash from Operating Activities | 26,000 |
| Cash Flow from Investing Activities | |
| Purchase of Property & Equipment | (10,000) |
| Sale of Old Equipment | 1,000 |
| Net Cash from Investing Activities | (9,000) |
| Cash Flow from Financing Activities | |
| Issuance of Long-Term Debt | 15,000 |
| Payment of Dividends | (3,000) |
| Net Cash from Financing Activities | 12,000 |
| Net Increase in Cash | 29,000 |
| Beginning Cash Balance | 10,000 |
| Ending Cash Balance | 39,000 |
Note: The ending cash balance on the Cash Flow Statement ($39,000) would match the Cash balance on the Balance Sheet from the same date.
How They Work Together: The Financial Symphony
Understanding each statement individually is a great start, but the real power comes from seeing how they interact. They are not isolated documents; they are deeply interconnected, each providing a piece of the puzzle that, when combined, tells a comprehensive story of a company’s financial journey.
-
The P&L Feeds the Balance Sheet:
- The Net Income (or Net Loss) from the P&L statement directly flows into the Retained Earnings section of the Balance Sheet. If a company makes a profit and doesn’t pay it all out as dividends, that profit increases the company’s equity.
-
The Balance Sheet Impacts the Cash Flow Statement (and vice versa):
- Changes in current assets (like Accounts Receivable, Inventory) and current liabilities (like Accounts Payable) on the Balance Sheet directly affect the Cash Flow from Operating Activities.
- Example: If Accounts Receivable increases, it means customers owe you more money, so less cash came in than sales reported, reducing operating cash flow.
- Changes in non-current assets (like PP&E) are reflected in Cash Flow from Investing Activities.
- Example: Buying new equipment (an increase in PP&E on the Balance Sheet) means a cash outflow in the investing section.
- Changes in debt and equity on the Balance Sheet are reflected in Cash Flow from Financing Activities.
- Example: Taking out a new loan (increase in Long-Term Debt) is a cash inflow in the financing section.
- The ending cash balance on the Cash Flow Statement must match the cash balance listed under Current Assets on the Balance Sheet for the same date.
- Changes in current assets (like Accounts Receivable, Inventory) and current liabilities (like Accounts Payable) on the Balance Sheet directly affect the Cash Flow from Operating Activities.
-
The Cash Flow Statement Validates the P&L and Balance Sheet:
- A strong Net Income on the P&L is great, but the Cash Flow Statement tells you if that profit is realized in cash. A company with high sales but poor cash collection will have a strong P&L but a weak operating cash flow.
- It helps explain changes in assets and liabilities on the Balance Sheet. For instance, a big increase in Inventory on the Balance Sheet might be explained by a large cash outflow for purchases in the Cash Flow from Operations.
In essence:
- P&L: "Did we make money (profit) over a period?"
- Balance Sheet: "What do we own, what do we owe, and what’s left for the owners at a specific point?"
- Cash Flow Statement: "Where did our cash come from, and where did it go during a period?"
Together, they provide a holistic, integrated view, allowing you to assess profitability, solvency, liquidity, and overall financial strength.
Conclusion: Your Journey to Financial Fluency
Understanding financial statements might seem daunting at first, but like any new language, it becomes clearer with practice. By grasping the core concepts of the P&L, Balance Sheet, and Cash Flow Statement, you unlock the ability to:
- Make smarter business decisions.
- Evaluate investment opportunities with confidence.
- Communicate effectively with financial professionals.
- Gain a deeper appreciation for the mechanics of commerce.
Don’t just look at the "bottom line" of the P&L. Dig deeper. Ask questions:
- Is the profit generating enough cash?
- Is the company relying too much on debt?
- Are assets growing sustainably?
These statements are not just historical records; they are powerful tools for forecasting, planning, and ensuring the long-term health and success of any enterprise. Start with these basics, and you’ll be well on your way to becoming financially fluent!
Frequently Asked Questions (FAQs)
Q1: What’s the main difference between the P&L and the Balance Sheet?
A1: The P&L (Income Statement) shows a company’s performance (profit or loss) over a period of time (e.g., a quarter). The Balance Sheet shows a company’s financial position (assets, liabilities, equity) at a single point in time (e.g., end of the year).
Q2: Why is cash flow so important if a company is already profitable?
A2: Profitability (Net Income) on the P&L doesn’t always mean a company has actual cash in the bank. Sales might be on credit, or inventory might be building up. The Cash Flow Statement shows the actual movement of cash, which is vital for paying bills, employees, and investing in growth. A profitable company can still go bankrupt if it runs out of cash.
Q3: Can a company have a positive Net Income but negative cash flow from operations?
A3: Yes, absolutely! This often happens when a company is growing rapidly and its Accounts Receivable (money owed by customers) and Inventory are increasing faster than cash is coming in. It can also happen due to significant non-cash expenses like depreciation or large one-time accruals. While sometimes a sign of growth, persistent negative operating cash flow despite positive net income can be a red flag.
Q4: Do small businesses need to prepare all three statements?
A4: Yes, ideally. While a small sole proprietorship might start with just a simple income statement, as the business grows, all three statements become essential for proper financial management, tax planning, securing loans, and attracting investors. Accounting software can often generate these reports automatically.
Q5: Where can I find a company’s financial statements?
A5: For publicly traded companies, you can typically find their financial statements (10-K for annual, 10-Q for quarterly) on the U.S. Securities and Exchange Commission’s (SEC) EDGAR database, or on the investor relations section of the company’s official website. For private companies, you would typically request them directly from the company.


Post Comment