
The Unemployment Rate Explained: Types, Measurement, and Why It Matters for Everyone
The unemployment rate is one of the most frequently cited economic statistics. You hear about it on the news, economists debate it, and politicians often refer to it when discussing the health of the economy. But what exactly does this number mean? Who counts as unemployed, and how is this rate calculated?
For beginners, understanding the unemployment rate can feel a bit like learning a new language. This comprehensive guide will break down the unemployment rate into easy-to-understand concepts, exploring its various types, how it’s measured, and why it’s such a crucial indicator for individuals, businesses, and governments alike.
What Exactly Is the Unemployment Rate?
At its simplest, the unemployment rate is a percentage that tells us how many people in the workforce are actively looking for a job but cannot find one. It’s a key indicator of the overall health of an economy and its labor market.
Think of it like a report card for the job market. A low unemployment rate generally suggests a strong economy with plenty of job opportunities, while a high rate often signals economic struggles, like a recession.
But before we dive deeper, it’s crucial to understand who is, and isn’t, included in the calculation.
Understanding the "Labor Force"
To calculate the unemployment rate, we first need to define the labor force. This isn’t just everyone in the country; it’s a specific group of people.
The labor force includes two main groups:
- The Employed: These are people who, during a specific survey week, worked for pay (even for one hour), worked 15 or more hours as unpaid workers in a family business, or were temporarily absent from their jobs due to illness, vacation, etc.
- The Unemployed: These are people who meet three key criteria:
- They do not have a job.
- They are available to work.
- They have actively looked for work in the past four weeks (e.g., submitting resumes, going to interviews, contacting employers).
Who Is NOT in the Labor Force?
It’s equally important to understand who is not counted in the labor force, as this often leads to common misunderstandings about the unemployment rate. This group includes:
- Retirees: People who have left the workforce due to age.
- Students: Those primarily focused on their education and not actively seeking work.
- Stay-at-Home Parents/Caregivers: Individuals who choose not to work outside the home to care for family.
- Institutionalized Persons: People in prisons, nursing homes, or mental health facilities.
- Discouraged Workers: This is a crucial category. These are people who want a job but have given up actively looking because they believe no jobs are available for them, or they feel they lack the necessary skills. Because they are not actively looking, they are not counted as unemployed in the official rate.
- People Not Seeking Work: Anyone who simply chooses not to work or is not looking for a job for other reasons (e.g., living off investments, illness that prevents work).
How Is the Unemployment Rate Measured?
The unemployment rate isn’t just a guess; it’s calculated using precise data collected through large-scale surveys.
The Formula
The basic formula for the unemployment rate is straightforward:
Unemployment Rate = (Number of Unemployed People / Total Labor Force) x 100
Let’s break this down with an example:
- Imagine a country has 160 million people in its labor force.
- Of those, 8 million people are unemployed (meeting the criteria of no job, available, and actively looking).
Unemployment Rate = (8,000,000 / 160,000,000) x 100
Unemployment Rate = 0.05 x 100
Unemployment Rate = 5%
Who Collects the Data?
In the United States, the unemployment data is primarily collected and reported by the Bureau of Labor Statistics (BLS), an agency within the U.S. Department of Labor. Other countries have similar government agencies (e.g., Statistics Canada, Eurostat, Office for National Statistics in the UK).
How Is the Data Collected?
The BLS uses a massive monthly survey called the Current Population Survey (CPS).
- Sample Size: Each month, the CPS surveys about 60,000 households across the U.S. This isn’t every household, but it’s a carefully selected sample designed to represent the entire population.
- Interviewers: Trained interviewers contact these households (in person or by phone) and ask a series of detailed questions about the employment status of every eligible person (usually 16 years and older) in that household during a specific "reference week."
- Questions Asked: Questions are designed to determine if someone is employed, unemployed (actively looking?), or not in the labor force. For instance, they might ask:
- "Did you do any work for pay or profit last week?"
- "Were you temporarily absent from a job last week?"
- "Did you look for work during the last 4 weeks?"
- "What was the main reason you did not look for work?"
- Data Compilation: The responses are then compiled, weighted, and analyzed to produce the national (and state/local) employment and unemployment figures, which are released monthly.
Understanding the Different Types of Unemployment
The overall unemployment rate is a useful figure, but it doesn’t tell the whole story. Economists categorize unemployment into different types based on its cause. Understanding these types helps us analyze the economy more deeply and formulate appropriate policies.
Here are the four main types of unemployment:
1. Frictional Unemployment
- What it is: This is short-term unemployment that occurs when people are voluntarily between jobs, searching for a new one, or just entering the workforce. It’s considered a natural and even healthy part of a dynamic economy.
- Why it happens:
- Job Searching: People need time to find the right job that matches their skills and preferences.
- New Entrants: Recent graduates or people returning to the workforce need time to find their first job.
- Voluntary Quits: Individuals leave one job to seek better opportunities or working conditions.
- Example: A software engineer quits her current job because she wants to find a position with more creative freedom. While she’s actively interviewing and reviewing offers, she is frictionally unemployed.
- Characteristics: Usually short-lived, reflects a healthy job market where people feel confident leaving jobs to find better ones.
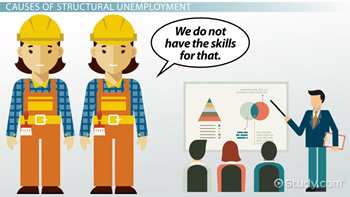
2. Structural Unemployment
- What it is: This type of unemployment occurs when there’s a mismatch between the skills workers have and the skills employers need, or when jobs are available in one location but workers are in another. It’s often longer-term and more serious than frictional unemployment.
- Why it happens:
- Technological Advancements: New technologies make certain jobs obsolete (e.g., factory workers replaced by robots).
- Industry Shifts: Decline of one industry and rise of another (e.g., coal mining jobs decreasing while renewable energy jobs increase).
- Globalization: Jobs moving to other countries where labor is cheaper.
- Lack of Education/Training: Workers lack the necessary education or training for available jobs.
- Geographic Mismatch: Jobs exist, but not where the unemployed workers live, and they are unable or unwilling to relocate.
- Example: A coal miner loses his job due to the closure of a mine and lacks the skills for new jobs in the booming tech industry in a nearby city. He is structurally unemployed.
- Characteristics: Can lead to long-term unemployment, requires retraining, education, or relocation to solve.
3. Cyclical Unemployment
- What it is: This is unemployment caused by a downturn in the overall economy, typically during a recession or economic contraction. When the economy slows down, businesses produce less, demand for goods and services falls, and they respond by laying off workers to cut costs.
- Why it happens:
- Recessions: Periods of significant decline in economic activity.
- Decreased Consumer Demand: People spend less, leading businesses to reduce production.
- Reduced Business Investment: Companies hold off on expanding or hiring during uncertain times.
- Example: During the 2008 financial crisis, many construction workers, factory employees, and service industry staff were laid off as consumer spending plummeted and businesses cut back. They were cyclically unemployed.
- Characteristics: Directly tied to the business cycle, tends to be widespread across many industries, and typically resolves as the economy recovers.
4. Seasonal Unemployment
- What it is: This is unemployment that occurs predictably at certain times of the year due to seasonal changes in demand for labor.
- Why it happens:
- Weather Patterns: Agriculture, construction, tourism (ski resorts in winter, beach resorts in summer).
- Holidays: Retail stores hiring extra staff for the holiday season and then letting them go afterward.
- Example: A lifeguard who works at a public beach is employed during the summer but is seasonally unemployed during the winter months.
- Characteristics: Predictable, often short-term, and specific to certain industries. It’s often factored out of "seasonally adjusted" unemployment rates to give a clearer picture of underlying trends.
The Natural Rate of Unemployment
When economists talk about "full employment," they don’t mean 0% unemployment. Instead, they refer to the natural rate of unemployment. This is the lowest unemployment rate that an economy can sustain without causing inflation to accelerate.
The natural rate of unemployment includes:
- Frictional Unemployment: Because people will always be changing jobs or entering the workforce.
- Structural Unemployment: Because industries evolve, and some skills will always become obsolete, while new ones emerge.
It does not include cyclical unemployment. When the economy is at its natural rate of unemployment, it means there is no cyclical unemployment – all unemployment is due to normal market adjustments. This rate varies over time due to demographic changes, technology, and policy.
Beyond the Headline Number: Different Measures of Unemployment (U-Rates)
The single "unemployment rate" you hear most often on the news (e.g., "The unemployment rate is 3.5%") is usually the U-3 rate. However, the BLS actually publishes six different measures of unemployment, from very narrow to very broad, which offer a more complete picture of the labor market’s health.
These are often called "U-rates" (U-1 through U-6):
- U-1: Persons Unemployed 15 Weeks or Longer, as a Percent of the Civilian Labor Force.
- Focus: Long-term unemployment.
- U-2: Job Losers and Persons Who Completed Temporary Jobs, as a Percent of the Civilian Labor Force.
- Focus: People who lost their jobs versus those who voluntarily left or are new entrants.
- U-3: Total Unemployed, as a Percent of the Civilian Labor Force (the official unemployment rate).
- Focus: The standard, widely reported number. It includes everyone who is jobless, available to work, and actively looked for work in the past four weeks.
- U-4: Total Unemployed Plus Discouraged Workers, as a Percent of the Civilian Labor Force Plus Discouraged Workers.
- Focus: Adds back discouraged workers, giving a slightly broader view of those who want a job but aren’t actively looking.
- U-5: Total Unemployed, Plus Discouraged Workers, Plus All Other Marginally Attached Workers, as a Percent of the Civilian Labor Force Plus All Marginally Attached Workers.
- Focus: Marginally attached workers are those who want and are available for work, and have looked for a job sometime in the prior 12 months (but not in the past 4 weeks).
- U-6: Total Unemployed, Plus All Marginally Attached Workers, Plus Total Employed Part Time for Economic Reasons, as a Percent of the Civilian Labor Force Plus All Marginally Attached Workers.
- Focus: This is the broadest measure, often called the "Underemployment Rate". It includes:
- Officially unemployed (U-3).
- Discouraged workers.
- Other marginally attached workers.
- Part-time workers who want and are available for full-time work but can only find part-time employment (sometimes called "involuntary part-time workers" or "underemployed").
- Focus: This is the broadest measure, often called the "Underemployment Rate". It includes:
Why the Difference Matters
- U-3 is the "headline" number because it’s consistent and provides a good snapshot of active job seekers.
- U-6 provides a more comprehensive picture of labor market slack. If U-3 is low but U-6 is high, it suggests that while fewer people are officially unemployed, many are stuck in part-time jobs or have given up looking, indicating underlying weakness in the job market.
- Policymakers and economists often look at both U-3 and U-6 to get a nuanced understanding of the economy.
Why Does the Unemployment Rate Matter?
The unemployment rate is more than just a dry statistic; it has profound implications for individuals, businesses, and the entire economy.
1. Indicator of Economic Health
- Strong Economy: A low and stable unemployment rate generally signals a healthy, growing economy. Businesses are confident, expanding, and hiring, which leads to more consumer spending and further economic growth.
- Weak Economy: A high or rising unemployment rate is a red flag, indicating a struggling economy, potentially in a recession. Businesses are cutting back, consumer confidence falls, and economic activity slows down.
2. Policy Decisions
- Monetary Policy: Central banks (like the Federal Reserve in the U.S.) closely watch the unemployment rate. If unemployment is high, they might lower interest rates to encourage borrowing and spending, stimulating job creation. If unemployment is too low and risking inflation, they might raise rates.
- Fiscal Policy: Governments use unemployment data to decide on fiscal policies, such as:
- Stimulus packages: Government spending on infrastructure or tax cuts to boost demand and create jobs during recessions.
- Unemployment benefits: Providing financial support to the unemployed to help them during difficult times and maintain some level of consumer spending.
- Job training programs: Investing in programs to help structurally unemployed workers gain new skills.
3. Social and Individual Impact
- Personal Well-being: Being unemployed can lead to financial hardship, stress, anxiety, loss of self-esteem, and even health problems.
- Poverty and Inequality: High unemployment disproportionately affects vulnerable groups and can worsen poverty and income inequality.
- Social Cohesion: Prolonged high unemployment can strain social safety nets, increase crime rates, and lead to social unrest.
- Consumer Spending: Unemployed people have less money to spend, which reduces overall demand in the economy, further hindering economic growth.
Limitations and Challenges of the Unemployment Rate
While incredibly useful, the unemployment rate isn’t a perfect measure and has certain limitations:
- Discouraged Workers Aren’t Counted: As mentioned, people who want a job but have given up looking are not included in the official U-3 rate, making the job market appear stronger than it is.
- Underemployment Isn’t Fully Captured (in U-3): The official rate doesn’t distinguish between a full-time, well-paying job and a part-time job that someone takes out of necessity. The U-6 rate helps address this, but it’s not the headline number.
- Doesn’t Measure Job Quality: The rate doesn’t tell us anything about wages, benefits, job security, or working conditions. A low unemployment rate could mask a proliferation of low-wage, precarious jobs.
- Doesn’t Account for "Phantom" Jobs: Sometimes, people apply for many jobs that don’t truly exist or are already filled, just to fulfill unemployment benefit requirements.
- Doesn’t Reflect Regional Differences: A national unemployment rate can hide significant variations in job markets across different states, cities, or rural areas.
- Data Collection Challenges: Relying on surveys means there’s always a margin of error and potential for misreporting.
Conclusion
The unemployment rate is a powerful and frequently referenced economic indicator that offers valuable insights into the health of a nation’s job market and economy. By understanding who counts as unemployed, how the data is collected, and the different types of unemployment, we can move beyond the simple percentage to grasp the complex dynamics at play.
While the official unemployment rate (U-3) is a vital barometer, considering broader measures like U-6 and recognizing the limitations of the data provides a more nuanced and accurate picture. It helps us understand not just how many people are looking for work, but also the challenges faced by those who are underemployed or have given up hope.
For students, job seekers, business owners, and engaged citizens alike, a clear understanding of the unemployment rate is essential for navigating the economic landscape and appreciating the human stories behind the numbers.

Post Comment