Leading vs. Lagging Economic Indicators: Navigating the Global Economic Landscape
Ever wonder how economists, investors, and policymakers get a pulse on the global economy? Do they have a crystal ball, or are they looking at a dashboard of carefully selected data points? The truth is, they’re doing a bit of both, by meticulously tracking what are known as economic indicators.
But not all indicators are created equal. Some whisper hints about the future, while others confirm what has already happened. This distinction is crucial for understanding economic trends, making informed decisions, and preparing for what lies ahead.
In this comprehensive guide, we’ll demystify the world of leading vs. lagging economic indicators, explore their global significance, and show you how they work together to paint a clearer picture of the economic landscape, even if you’re just starting your economic journey.
What Are Economic Indicators? The Economy’s Health Check
Before we dive into the "leading" and "lagging" aspects, let’s understand the basics. Economic indicators are simply pieces of economic data, usually statistics, that help us understand the health and direction of an economy. Think of them like vital signs for a patient:
- Temperature: Inflation rate
- Heart Rate: GDP growth
- Blood Pressure: Unemployment rate
By tracking these indicators over time, we can identify patterns, predict potential shifts, and make better decisions. They are essential tools for:
- Governments: To formulate policies (like interest rate changes or stimulus packages).
- Businesses: To plan investments, hiring, and production.
- Investors: To make decisions about stocks, bonds, and other assets.
- Individuals: To understand the broader economic environment affecting their jobs, savings, and purchasing power.
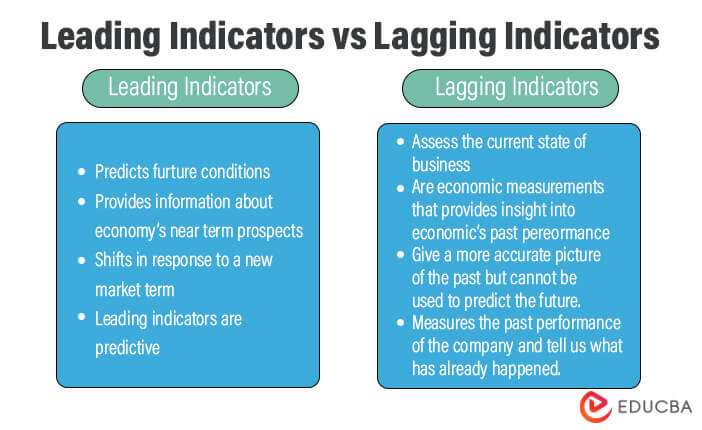
Leading Economic Indicators: The Crystal Ball of the Economy
Imagine a weather forecast that tells you it’s going to rain tomorrow. That’s the essence of a leading economic indicator. Leading economic indicators are data points that tend to change before the economy as a whole changes. They are like early warning signals, offering a glimpse into future economic activity.
They don’t guarantee what will happen, but they provide valuable clues and help economists and analysts form predictions.
Key Characteristics of Leading Indicators:
- Forward-looking: They anticipate future economic movements.
- Predictive Power: They often signal peaks and troughs in the business cycle before they occur.
- Volatility: They can sometimes give false signals or be revised later.
Common Examples of Leading Economic Indicators:
- Stock Market Performance:
- Why it’s leading: Stock prices reflect investors’ expectations about future corporate earnings and the overall economic outlook. If investors are optimistic, stocks tend to rise, signaling potential future growth. A significant market downturn often precedes a recession.
- Building Permits/Housing Starts:
- Why it’s leading: Issuing a building permit means construction is planned for the near future. An increase in permits suggests optimism among builders and indicates future job creation and economic activity in the construction sector and related industries (materials, appliances).
- Manufacturing New Orders:
- Why it’s leading: When factories receive more orders for goods, it suggests increased production will be needed soon. This signals future industrial activity, hiring, and investment. Surveys like the Purchasing Managers’ Index (PMI) often include a new orders component.
- Consumer Confidence Index:
- Why it’s leading: If consumers feel good about their financial future and the economy, they are more likely to spend money on goods and services. Since consumer spending drives a significant portion of most economies, changes in confidence can signal future retail sales and economic growth.
- Interest Rate Spreads (Yield Curve):
- Why it’s leading: This refers to the difference between long-term and short-term interest rates. Typically, long-term rates are higher than short-term rates. When this "yield curve" inverts (short-term rates become higher than long-term rates), it has historically been a very reliable predictor of future recessions, as it signals market expectations of slower growth and lower inflation ahead.
- Average Weekly Hours in Manufacturing:
- Why it’s leading: Before companies hire or fire workers, they often adjust the hours of their existing workforce. An increase in average hours suggests businesses are gearing up for more production, while a decrease can signal a slowdown.
The Power and Peril of Leading Indicators:
- Pros: Provide early warnings, allowing for proactive adjustments by businesses, investors, and policymakers.
- Cons: Can be volatile and prone to "false signals" (e.g., predicting a downturn that never fully materializes). They need to be used in conjunction with other indicators.
Lagging Economic Indicators: The Rearview Mirror of the Economy
If leading indicators are the weather forecast for tomorrow, lagging economic indicators are like looking out the window after it has already started raining. They are data points that change after the economy has already begun to follow a particular trend. They confirm what has happened, providing a historical perspective.
While they don’t predict the future, they are essential for understanding the severity and duration of economic cycles, and for confirming trends that leading indicators might have only hinted at.
Key Characteristics of Lagging Indicators:
- Backward-looking: They reflect past economic performance.
- Confirmatory: They confirm trends that are already underway.
- Reliable: They are less prone to false signals once a trend is established.
Common Examples of Lagging Economic Indicators:
- Gross Domestic Product (GDP):
- Why it’s lagging: GDP measures the total value of all goods and services produced in an economy over a specific period (usually a quarter or a year). It’s the ultimate measure of economic output, but the data is collected and released after the period has ended, making it a confirmation of past growth or contraction.
- Unemployment Rate:
- Why it’s lagging: Businesses typically don’t lay off workers immediately when demand slows, nor do they hire immediately when demand picks up. They often wait to see if a trend is sustained. Therefore, changes in the unemployment rate usually lag behind changes in economic output.
- Inflation Rate (Consumer Price Index – CPI):
- Why it’s lagging: Inflation (the rate at which prices for goods and services are rising) usually reflects past supply and demand dynamics. It takes time for price changes to filter through the economy and be measured. Central banks often react to sustained inflation trends that have already taken hold.
- Corporate Profits:
- Why it’s lagging: Companies report their earnings after a quarter or year has ended. These profits reflect sales and costs from the past period, confirming the health of businesses during that time.
- Average Prime Rate:
- Why it’s lagging: The prime rate is the interest rate banks charge their most creditworthy customers. It typically moves in response to the federal funds rate set by central banks, which in turn reacts to observed economic conditions like inflation and unemployment.
- Duration of Unemployment:
- Why it’s lagging: This indicator measures how long people have been unemployed. It tends to increase significantly during a recession and remains high even as the economy begins to recover, only falling significantly once the recovery is well underway.
The Value of Lagging Indicators:
- Pros: Provide definitive confirmation of economic trends, helping to understand the depth and breadth of a recession or expansion. Crucial for evaluating the effectiveness of past policies.
- Cons: Not useful for predicting future turns, as they tell you about the past.
The Interplay: How Leading and Lagging Indicators Work Together
Think of navigating a car. You need both a clear view through the windshield (leading indicators) to see upcoming turns and obstacles, and an occasional glance in the rearview mirror (lagging indicators) to confirm where you’ve been and if your current speed is appropriate.
No single indicator, whether leading or lagging, can provide a complete picture. Economists, analysts, and policymakers use a composite approach, observing a wide array of indicators and looking for patterns and confirmations.
The Business Cycle and Indicators:
Economic indicators are intrinsically linked to the business cycle, which describes the natural ups and downs of economic activity (expansion, peak, contraction, trough).
- Before a Peak (End of Expansion): Leading indicators might start to decline, signaling a slowdown is coming. Lagging indicators like employment and inflation are still strong.
- During a Contraction (Recession): Leading indicators continue to fall, while lagging indicators (like GDP and employment) start to show significant declines, confirming the recession.
- Before a Trough (End of Recession): Leading indicators might start to turn upwards, suggesting a recovery is on the horizon. Lagging indicators are still showing weakness.
- During an Expansion (Recovery): Leading indicators rise, followed by lagging indicators (like GDP growth and falling unemployment) confirming the recovery.
This dynamic interplay helps us understand not just where the economy is, but where it’s likely headed.
A Global Perspective: One World, Many Economies
While the concepts of leading and lagging indicators are universal, their specific relevance and the indicators tracked can vary across different countries and regions. The global economy is a vast, interconnected web, but each nation has its own unique economic structure, policy priorities, and data availability.
Why Global Differences Matter:
- Economic Structure: An economy heavily reliant on manufacturing (like Germany or China) might pay closer attention to manufacturing PMIs and industrial production, while a service-based economy (like the UK or US) might focus more on consumer confidence and service sector indices.
- Policy Goals: Some countries might prioritize stable inflation, while others might focus more on employment or trade balances.
- Data Availability & Reliability: The quality and timeliness of economic data can differ significantly between developed and developing nations.
- Interconnectedness: A slowdown in one major economy (e.g., China) can quickly impact others through global supply chains, trade, and investor confidence, making international indicators crucial.
Key Global Indicators and Their Regional Relevance:
- United States:
- Leading: ISM Manufacturing/Services PMI, Conference Board Leading Economic Index (LEI), Consumer Confidence, Housing Starts.
- Lagging: GDP, Unemployment Rate, CPI, Corporate Earnings.
- European Union (Eurozone):
- Leading: Eurozone PMI Composite (manufacturing and services), ZEW Economic Sentiment Index (Germany), Industrial New Orders.
- Lagging: Eurozone GDP, Harmonised Index of Consumer Prices (HICP), Eurozone Unemployment Rate.
- China:
- Leading: Caixin/NBS Manufacturing & Services PMIs, Fixed Asset Investment, Retail Sales (though can be lagging depending on interpretation).
- Lagging: GDP, Industrial Production, CPI, Trade Balance.
- Japan:
- Leading: Tankan Survey (business sentiment), Machine Tool Orders.
- Lagging: GDP, Core CPI, Unemployment Rate.
Understanding these regional nuances is vital for anyone analyzing global economic trends or making international investment decisions. A strong manufacturing PMI in Germany, for example, could signal increased demand for raw materials from other parts of the world.
Using Indicators for Decision-Making: Practical Applications
The beauty of economic indicators lies in their practical application for various stakeholders:
For Investors:
- Timing Investments: Leading indicators can signal when to be more aggressive (early expansion) or defensive (approaching a recession).
- Asset Allocation: A strong outlook (signaled by leading indicators) might favor equities, while a weakening outlook might push investors towards bonds or defensive sectors.
- Sector Selection: Understanding which sectors are more sensitive to specific indicators (e.g., housing stocks and building permits).
For Businesses:
- Production Planning: Anticipating demand shifts using leading indicators like new orders or consumer confidence.
- Hiring Decisions: Adjusting workforce size based on expectations of future economic activity.
- Investment Decisions: Deciding whether to expand facilities or invest in new equipment based on the economic outlook.
- Inventory Management: Preventing overstocking during slowdowns or understocking during booms.
For Governments and Policymakers:
- Monetary Policy (Central Banks): Using inflation, unemployment, and growth indicators to decide on interest rate changes or quantitative easing/tightening.
- Fiscal Policy: Deciding on government spending, tax cuts, or stimulus packages based on the state of the economy.
- Early Warning Systems: Identifying potential crises or recessions early to implement preventative measures.
Challenges and Limitations of Economic Indicators
While invaluable, economic indicators are not perfect and come with their own set of challenges:
- False Signals: Especially leading indicators can sometimes "cry wolf," signaling a downturn that doesn’t fully materialize, leading to premature actions.
- Revisions: Many initial economic data releases are estimates and are frequently revised later, sometimes significantly, changing the initial picture.
- Lag Time in Data Release: Even "leading" indicators have a slight lag between the event and its measurement/release. Lagging indicators have a much longer delay.
- Black Swan Events: Unforeseen and impactful events (like the COVID-19 pandemic or a major natural disaster) can drastically alter economic trajectories, rendering historical indicator relationships temporarily less reliable.
- Changing Economic Structures: As economies evolve (e.g., from manufacturing to service-based), the relevance and weight of certain indicators can change over time.
- Data Quality and Comparability: Across different countries, data collection methodologies, definitions, and reporting frequencies can vary, making direct comparisons challenging.
Conclusion: A Dashboard, Not a Crystal Ball
Understanding leading vs. lagging economic indicators is like learning to read the dashboard of the global economy. No single gauge will tell you everything, but together, they provide a powerful set of tools for anticipating trends, confirming shifts, and making more informed decisions.
For beginners, the key is to remember:
- Leading indicators are your headlights, showing you what might be ahead.
- Lagging indicators are your rearview mirror, confirming where you’ve been.
By observing a diverse range of these indicators, both domestically and internationally, you can develop a more nuanced and accurate understanding of the complex, ever-evolving global economic landscape. Continue to explore, learn, and question, and you’ll be well on your way to becoming a more economically literate citizen of the world.


Post Comment