The Phillips Curve: Unraveling the Inflation and Unemployment Trade-off
The world of economics often feels like a complex puzzle, with countless pieces moving simultaneously. Among the most enduring and debated concepts is the Phillips Curve, a fascinating idea that suggests a relationship between inflation (the rate at which prices rise) and unemployment (the percentage of the workforce without jobs).
For decades, this concept has been a cornerstone for policymakers, guiding decisions about interest rates, government spending, and the overall health of an economy. But what exactly is the Phillips Curve? How has our understanding of it evolved? And what does it mean for you, your job, and your wallet?
This comprehensive guide will break down the Phillips Curve, making it easy for anyone to understand its origins, its evolution, and its profound implications for economic policy.
What is The Phillips Curve? The Basic Idea
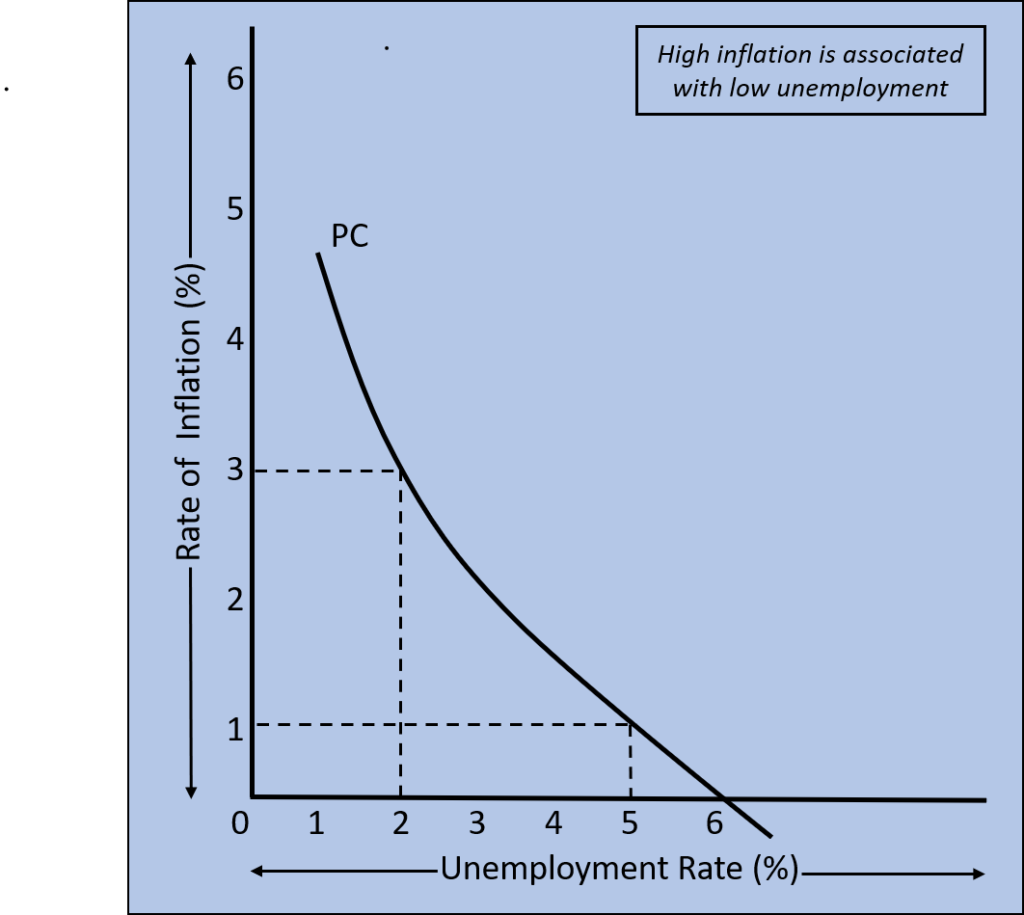
At its heart, the Phillips Curve proposes a simple, yet powerful, idea: there is an inverse relationship between unemployment and inflation.
Imagine a seesaw. When one side goes down, the other goes up. In the context of the Phillips Curve:
- When unemployment is low (many people have jobs), inflation tends to be high (prices rise faster).
- When unemployment is high (fewer people have jobs), inflation tends to be low (prices rise slower, or even fall).
This initial observation was made by economist A.W. Phillips in 1958, who studied data from the UK over nearly a century. He found that periods of low unemployment were consistently associated with periods of high wage growth, which in turn often led to higher inflation.
Why would this relationship exist?
Think about it from the perspective of demand and supply in the labor market:
- High Demand for Workers (Low Unemployment): When many businesses are expanding and hiring, there’s a high demand for workers. This gives employees more bargaining power, leading to higher wages.
- Higher Wages, Higher Costs: For businesses, higher wages mean higher production costs. To maintain profit margins, they often pass these increased costs on to consumers in the form of higher prices for goods and services. This is inflation.
- Low Demand for Workers (High Unemployment): Conversely, when the economy is slowing down and fewer jobs are available, workers have less bargaining power. Wage growth slows or even stagnates, reducing cost pressures on businesses and leading to lower inflation.
This initial understanding of the Phillips Curve suggested a trade-off that policymakers could exploit: governments could choose to tolerate higher inflation to achieve lower unemployment, or vice-versa.
The Short-Run Phillips Curve: The Trade-Off in Action
The "original" Phillips Curve, as described above, is now often referred to as the Short-Run Phillips Curve (SRPC). It depicts the immediate, temporary relationship between inflation and unemployment.
How it works in the short run:
- Stimulating the Economy: If a government or central bank wants to reduce unemployment, they might implement policies to stimulate economic demand.
- Monetary Policy: The central bank (like the Federal Reserve in the U.S.) could lower interest rates, making it cheaper for businesses to borrow and invest, and for consumers to borrow and spend.
- Fiscal Policy: The government could increase its own spending (e.g., on infrastructure) or cut taxes, leaving more money in people’s pockets to spend.
- Increased Demand, Lower Unemployment: This increased spending and investment leads to higher overall demand for goods and services. Businesses respond by hiring more workers to meet this demand, thus reducing unemployment.
- Inflationary Pressure: As the economy heats up and unemployment falls, businesses compete for scarce workers, pushing up wages. They also face higher demand for their products, allowing them to raise prices without losing customers. This results in higher inflation.
The Policy Dilemma:
The Short-Run Phillips Curve presents a clear choice for policymakers:
- Do we accept a bit more inflation to get more people working?
- Or do we accept higher unemployment to keep prices stable?
For a time, especially in the 1960s, this trade-off seemed to hold true, offering a menu of policy options.
The Long-Run Phillips Curve: The Disappearing Trade-Off
The apparent stability of the Phillips Curve began to unravel in the 1970s. Economies around the world experienced stagflation – a puzzling combination of high inflation and high unemployment. This phenomenon contradicted the Short-Run Phillips Curve’s prediction.
Economists like Milton Friedman and Edmund Phelps provided the crucial insight: the short-run trade-off between inflation and unemployment disappears in the long run.
Why does the trade-off disappear? The crucial role of Expectations.
The key to understanding the Long-Run Phillips Curve (LRPC) lies in how people and businesses form their expectations about inflation.
- Initial Policy Stimulus (Short-Run Effect): Let’s say the central bank tries to reduce unemployment by stimulating the economy, leading to unexpected inflation. Workers and businesses are initially "fooled" by this higher inflation.
- Workers might accept seemingly higher nominal wages, not realizing their real purchasing power hasn’t increased (or has even decreased).
- Businesses might produce more because they see their selling prices rising faster than their costs.
- Adjusting Expectations (Long-Run Effect): Over time, people learn. If inflation consistently runs higher than expected, workers will demand higher nominal wages to compensate for the erosion of their purchasing power. Businesses will realize their costs are rising as fast as their prices.
- Adaptive Expectations: People form their expectations based on past inflation. If inflation was 3% last year, they expect 3% this year. If it turns out to be 5%, they’ll expect 5% (or higher) next year.
- Rational Expectations: People use all available information, including government policy announcements, to form their expectations. They anticipate the effects of policy changes.
- No Permanent Gain in Employment: As workers demand and receive higher wages (to match the higher inflation), and businesses adjust their prices and output based on these new expectations, the temporary boost to employment disappears. The economy eventually returns to its "natural" level of unemployment, but at a higher rate of inflation.
The Natural Rate of Unemployment (NAIRU):
This "natural" level of unemployment is also known as the Non-Accelerating Inflation Rate of Unemployment (NAIRU). It’s the lowest unemployment rate an economy can sustain without causing inflation to continually accelerate. It’s not necessarily zero unemployment, as there will always be some frictional (people between jobs) and structural (mismatch of skills) unemployment.
The Long-Run Phillips Curve is Vertical:
Because the trade-off disappears in the long run, the Long-Run Phillips Curve is depicted as a vertical line at the NAIRU. This means that in the long run, monetary or fiscal policy designed to stimulate demand can only affect the inflation rate, not the unemployment rate. Trying to push unemployment below its natural rate will only lead to ever-increasing inflation.
Factors That Shift the Phillips Curve
While the basic relationship holds, various factors can cause the Phillips Curve to shift, both in the short run and the long run:
- Changes in Inflationary Expectations: This is the most common reason for shifts in the Short-Run Phillips Curve.
- If people expect higher inflation, the SRPC shifts upward. To achieve any given unemployment rate, the actual inflation rate will be higher.
- If people expect lower inflation, the SRPC shifts downward.
- Supply Shocks: Unexpected events that affect the cost of production can shift the Short-Run Phillips Curve.
- Negative Supply Shock (e.g., oil price spike): Increases production costs for businesses, leading to higher prices (inflation) and lower output (higher unemployment). This shifts the SRPC upward and to the right. This is what contributed to stagflation in the 1970s.
- Positive Supply Shock (e.g., technological innovation): Decreases production costs, leading to lower prices and higher output. This shifts the SRPC downward and to the left.
- Changes in the Natural Rate of Unemployment (NAIRU): Factors that fundamentally change the structure of the labor market can shift the Long-Run Phillips Curve.
- Structural Reforms: Policies that improve labor market efficiency (e.g., better job matching services, education and training programs, reduced barriers to employment) can lower NAIRU, shifting the LRPC to the left.
- Demographic Shifts: Changes in the age structure of the population or labor force participation rates can affect NAIRU.
- Labor Market Rigidities: Strong unions, high minimum wages, or generous unemployment benefits can sometimes increase NAIRU by making it harder for wages to adjust or for people to find jobs.
Historical Context and Real-World Examples
Understanding the Phillips Curve is often best done by looking at history:
- The 1960s: The "Golden Age" of the Phillips Curve:
- Policymakers believed they could fine-tune the economy. Strong economic growth and relatively stable inflation seemed to confirm the short-run trade-off. Lower unemployment was achieved with a manageable increase in inflation.
- The 1970s: The Era of Stagflation and the Curve’s Breakdown:
- Multiple negative supply shocks (oil price embargoes) combined with rising inflationary expectations (due to previous expansionary policies) led to a period where both inflation and unemployment were high. This was the defining moment that led to the development of the Long-Run Phillips Curve theory.
- The 1980s: Disinflation and the Cost of Lowering Inflation:
- Central banks, notably the Federal Reserve under Paul Volcker, aggressively raised interest rates to combat inflation. This led to a deep recession and high unemployment, but successfully brought inflation down. This period demonstrated the short-run cost of disinflation – moving down a short-run Phillips curve, but at a higher level of unemployment, before expectations adjusted and the economy moved back towards NAIRU.
- The 1990s and Early 2000s: The "Great Moderation":
- Relatively stable economic growth with low inflation and low unemployment. Some argued that globalization, technological advancements, and more credible central bank policies had either flattened the short-run curve or anchored expectations, making the trade-off less pronounced.
- Post-2008 Financial Crisis & COVID-19:
- After the Great Recession, unemployment fell significantly, but inflation remained stubbornly low for a long time, challenging the traditional Phillips Curve relationship. This led to debates about the "flattening" of the curve, global influences, and the impact of technology.
- The COVID-19 pandemic brought unique supply shocks and demand shifts, causing a surge in inflation despite initial spikes in unemployment, further complicating the picture.
Policy Implications for Governments and Central Banks
The Phillips Curve remains a vital framework for economic policy, especially for monetary policy (controlled by central banks) and fiscal policy (controlled by governments).
- Monetary Policy (Central Banks):
- Goal: Central banks often have a "dual mandate" – to achieve maximum sustainable employment and price stability (low, stable inflation).
- Dilemma: The Phillips Curve highlights the inherent tension between these goals in the short run. Lowering interest rates to boost employment might risk higher inflation. Raising interest rates to curb inflation might increase unemployment.
- Credibility: For central banks, maintaining credibility is crucial. If people trust that the central bank is committed to low inflation, their inflationary expectations will remain anchored, making it easier to manage the economy without triggering runaway inflation.
- Fiscal Policy (Governments):
- Governments use spending and taxation to influence aggregate demand.
- Stimulus: During recessions, increased government spending or tax cuts can boost demand, reduce unemployment, but potentially increase inflation.
- Austerity: During inflationary periods, reduced spending or tax increases can cool demand, reduce inflation, but potentially increase unemployment.
- The Long-Run Focus: Both central banks and governments now largely acknowledge the long-run vertical Phillips Curve. Their primary focus is often on achieving the natural rate of unemployment and maintaining price stability, rather than trying to permanently "buy" lower unemployment with higher inflation. They understand that attempts to do so will only lead to accelerating inflation without lasting employment gains.
Criticisms and Modern Views
While the Phillips Curve remains a core concept, it’s not without its critics and ongoing debates:
- The "Flattening" of the Curve: Some economists argue that the short-run Phillips Curve has become much flatter in recent decades. This means that a large decrease in unemployment now causes only a small increase in inflation, and vice-versa. Possible reasons include:
- Globalization: Increased competition from abroad limits domestic firms’ ability to raise prices.
- E-commerce & Price Transparency: Online shopping makes it easier for consumers to compare prices, putting downward pressure on inflation.
- Weakened Labor Unions: Reduced bargaining power for workers.
- Anchored Expectations: Central banks’ success in keeping inflation low and stable for decades has made people’s inflation expectations very stable.
- Supply-Side Economics: This school of thought emphasizes that policies focused on improving the supply side of the economy (e.g., tax cuts to encourage investment, deregulation, education) can lower both unemployment and inflation by shifting the NAIRU itself, rather than just moving along the short-run curve.
- Data Challenges: Measuring concepts like NAIRU precisely is difficult, and the relationship can vary over time and across different economies.
Conclusion
The Phillips Curve, initially a simple observation, has evolved into a sophisticated framework for understanding the complex interplay between inflation and unemployment. While the naive short-run trade-off proved unsustainable in the long run due to the crucial role of expectations, the concept remains fundamental to economic policy.
Policymakers no longer believe they can permanently "buy" lower unemployment with higher inflation. Instead, their efforts are geared towards:
- Maintaining price stability by anchoring inflation expectations.
- Allowing the economy to operate at or near its natural rate of unemployment (NAIRU).
- Responding to temporary supply shocks without letting them lead to runaway inflation.
The Phillips Curve serves as a powerful reminder that there are often trade-offs in economic policy, and that understanding how people and businesses react to policy changes is key to achieving sustainable economic growth and stability. While its exact shape and predictive power are continually debated, its core message – the delicate balance between prices and jobs – remains as relevant as ever.


Post Comment