
The Yield Curve Inversion: A Reliable Recession Predictor? Decoding the Economic Alarm Bell
The economy is a complex beast, constantly shifting and evolving. For individuals, businesses, and investors alike, understanding its signals is crucial. Among the many indicators economists and financial analysts scrutinize, one has consistently garnered attention for its uncanny ability to foreshadow economic downturns: the yield curve inversion.
Often whispered about in financial news and online forums, the phrase "yield curve inversion" can sound like a cryptic warning from a secret society of economists. But what exactly is it? Why does it matter? And is it truly a reliable predictor of a recession, or just another piece of financial jargon that causes unnecessary panic?
In this comprehensive guide, we’ll demystify the yield curve, explain what an inversion means, explore its historical accuracy, and help you understand what it could signal for the economy and your financial future.
What Exactly is "The Yield Curve"? Understanding the Basics
Before we dive into the "inversion," let’s first understand the "yield curve" itself.
Imagine you’re lending money to the U.S. government (which is essentially what you do when you buy a Treasury bond). You can lend it for different periods:
- Short-term: A few months or a year (e.g., a 3-month Treasury Bill).
- Medium-term: A few years (e.g., a 5-year Treasury Note).
- Long-term: Many years, often 10, 20, or even 30 years (e.g., a 10-year Treasury Bond).
The yield is the return you get on your investment, expressed as an annual percentage. Generally, the longer you lend your money, the more risk you take on (things can change a lot over 30 years!), so you expect a higher return or yield.
The yield curve is simply a graph that plots the yields of bonds with different maturities, from shortest to longest.
The "Normal" Yield Curve Shape
In a healthy, growing economy, the yield curve typically slopes upward. This means:
- Short-term bonds have lower yields (less risk, less time commitment).
- Long-term bonds have higher yields (more risk, longer time commitment).
Think of it like this: If you put your money in a savings account for one month, you’d expect a tiny interest rate. If you locked it away for 10 years, you’d demand a much better rate because you can’t touch that money for a decade, and who knows what inflation or other economic changes might occur?
This upward-sloping curve is considered "normal" because it reflects the market’s expectation of future economic growth and inflation.
What is a Yield Curve Inversion? The Unusual Signal
A yield curve inversion occurs when this normal relationship flips. Specifically, it happens when:
- Short-term bond yields become higher than long-term bond yields.
For example, if the yield on a 2-year Treasury bond is 5%, but the yield on a 10-year Treasury bond is only 4.5%, the yield curve has inverted. On a graph, instead of sloping upwards, it dips downwards.
This is highly unusual because it means lenders are getting less return for locking their money up for a longer period. It’s like asking for a higher interest rate on a one-month loan than on a ten-year loan. It doesn’t make intuitive sense unless something significant is at play.
Why Does the Yield Curve Invert? The Forces at Play
An inverted yield curve isn’t a random event; it’s the result of powerful forces in the financial markets and reflects deep concerns about the future economic outlook.
The primary drivers are typically:
-
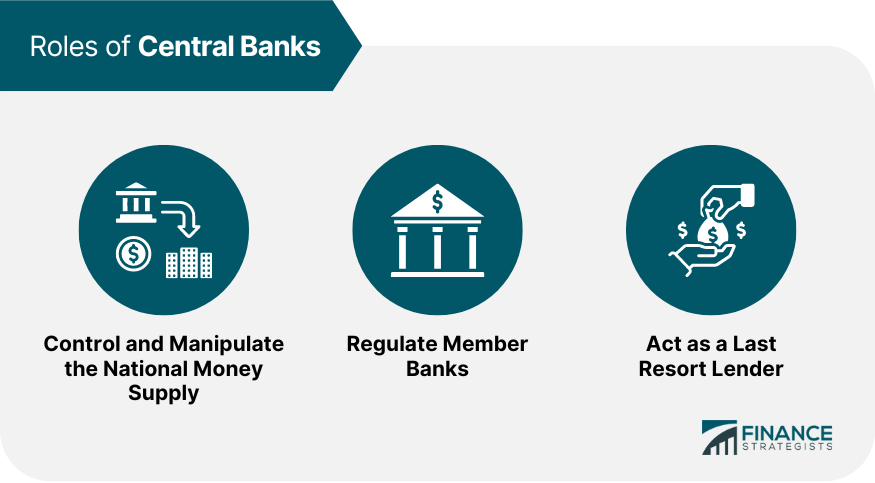
Federal Reserve (The Fed) Actions:
- The Fed, the central bank of the U.S., controls short-term interest rates. When inflation is high or the economy is "overheating," the Fed often raises its benchmark interest rate (the federal funds rate) to slow things down.
- These rate hikes directly push up the yields on short-term Treasury bonds.
- Analogy: The Fed is hitting the brakes on a fast-moving car.
-
Long-Term Market Expectations:
- While the Fed controls the short end, long-term bond yields are more influenced by the market’s expectations for future economic growth, inflation, and demand for safe assets.
- When investors see the Fed aggressively raising short-term rates, they often interpret this as a sign that the Fed will successfully bring inflation down and that economic growth will slow significantly, possibly leading to a recession.
- In anticipation of slower growth and lower inflation in the future, investors are willing to accept lower yields on long-term bonds. They might also buy more long-term bonds as a "safe haven" during uncertain times, which drives their yields down.
- Analogy: Investors see storm clouds on the horizon and are preparing for a slowdown, making them less demanding about long-term returns.
In essence, a yield curve inversion is a signal that bond investors are anticipating lower interest rates in the future than they are today, often due to an expected economic slowdown or recession.
The Track Record: Why the Yield Curve Inversion is a Notorious Predictor
This is where the yield curve inversion earns its reputation. Historically, it has been an incredibly accurate predictor of recessions in the United States.
Consider the following historical instances:
- 1980 & 1981 Inversions: Preceded the early 1980s recessions (the "Volcker Recession" aimed at taming inflation).
- 1989 Inversion: Preceded the early 1990s recession.
- 2000 Inversion: Preceded the dot-com bubble burst recession.
- 2006 Inversion: Preceded the Great Recession (2007-2009) and the housing market collapse.
- 2019 Inversion: Preceded the brief but sharp COVID-19 recession in 2020.
- 2022-2023 Inversion: We are currently in an extended period of inversion, sparking widespread debate about a potential upcoming recession.
Key Observations from History:
- Consistency: Every U.S. recession since 1955 has been preceded by an inversion of the 10-year and 3-month Treasury yield curve.
- Lag Time: It’s important to note that an inversion doesn’t mean a recession is immediate. There’s typically a lag time, which can range from 6 to 24 months after the inversion first appears. This is why it’s a "predictor," not an "on-the-spot indicator."
- No False Positives (for the 10-year/3-month curve): For this specific yield spread, there have been no instances where it inverted and a recession didn’t follow. This is what makes it so compelling.
The Economic Logic: Why Does It Work?
Beyond the historical correlation, there’s sound economic logic explaining why an inverted yield curve often signals trouble ahead:
-
Banking Profit Squeeze:
- Banks are at the heart of the economy. Their traditional business model involves "borrowing short" (taking deposits, which are essentially short-term loans from customers) and "lending long" (offering mortgages, business loans, etc., which are long-term loans).
- When the yield curve inverts, the cost for banks to borrow short-term money (what they pay depositors) becomes higher than the interest they can earn on new long-term loans.
- This "profit squeeze" discourages banks from lending, leading to a credit crunch. Businesses find it harder and more expensive to borrow, stifling investment and expansion.
-
Reduced Business Investment:
- Businesses rely on borrowing for capital expenditures (new equipment, factories), expansion, and even day-to-day operations.
- With higher short-term borrowing costs and a general atmosphere of economic uncertainty signaled by the inversion, companies become more cautious. They postpone investments, slow hiring, and might even lay off workers.
-
Deteriorating Consumer Confidence:
- News of an inverted yield curve, combined with rising interest rates and concerns about inflation, can make consumers feel less secure about their financial future.
- This leads to reduced spending, especially on big-ticket items like homes and cars, further slowing down economic activity.
-
Expectations Become Self-Fulfilling:
- If enough people (investors, businesses, consumers) believe a recession is coming, their actions (reduced spending, less investment, more saving) can actually help bring one about. The yield curve inversion acts as a powerful, public signal that reinforces these expectations.
Is It Always Right? Nuance and Caveats
While the yield curve’s track record is impressive, it’s crucial to approach it with nuance. It’s a powerful indicator, but not a crystal ball.
-
The Lag Time Varies: As mentioned, the time between inversion and recession can vary significantly. This makes it difficult to pinpoint the exact timing of a downturn. You can’t set your calendar by it.
-
Correlation vs. Causation: Does the inverted yield curve cause a recession, or is it merely a highly accurate symptom of underlying economic problems that will lead to a recession? Most economists view it as the latter – a powerful signal reflecting market expectations, rather than the direct cause.
-
"This Time is Different" Syndrome: Every economic cycle has unique characteristics. Some argue that structural changes in the economy, like the rise of tech companies or increased globalization, might alter the predictive power of old indicators. However, the yield curve has remained remarkably consistent through various economic shifts.
-
Other Factors Matter: An inverted yield curve should not be viewed in isolation. Other economic indicators, geopolitical events, and unexpected "black swan" events (like a global pandemic) can significantly impact the economy, sometimes overriding or delaying the yield curve’s signal.
What Does a Yield Curve Inversion Mean for You?
If the yield curve has inverted, it’s not a call to panic, but rather a nudge to be prepared and informed.
For Investors:
- Reassess Risk: Consider whether your portfolio is too heavily weighted towards high-growth, risky assets.
- Defensive Stocks: Some investors shift towards "defensive" sectors that tend to perform better during downturns, such as utilities, consumer staples, and healthcare.
- Cash and Bonds: An inverted yield curve can make short-term bonds more attractive. Holding some cash or short-term fixed income can provide liquidity and stability.
- Dollar-Cost Averaging: Continue regular investments to average out your purchase price, rather than trying to time the market.
For Businesses:
- Review Budgets: Prepare for potentially slower demand and tighter credit conditions.
- Manage Debt: Reduce reliance on variable-rate debt, which becomes more expensive with rising short-term rates.
- Optimize Operations: Look for efficiencies and cost-saving measures.
- Cash Flow Management: Ensure strong cash reserves to weather potential storms.
For Consumers:
- Build an Emergency Fund: If you haven’t already, prioritize saving 3-6 months’ worth of living expenses.
- Reduce High-Interest Debt: Pay down credit card balances and other variable-rate loans.
- Job Security: Evaluate your career prospects and consider upskilling or diversifying your income streams.
- Major Purchases: If considering a large purchase (like a home or car), be mindful of rising interest rates and potential job market shifts.
Beyond the Inversion: Other Key Economic Indicators to Watch
While the yield curve is a powerful signal, a holistic view of the economy requires looking at a broader range of indicators:
- Gross Domestic Product (GDP) Growth: Measures the total value of goods and services produced. Two consecutive quarters of negative GDP growth are often considered a "technical recession."
- Unemployment Rate: A rising unemployment rate is a strong sign of economic contraction.
- Inflation Rate: High and persistent inflation can erode purchasing power and lead to central bank tightening.
- Consumer Confidence: Surveys that gauge how optimistic consumers are about the economy and their financial future.
- Retail Sales: Indicates consumer spending trends, a major driver of the economy.
- Manufacturing and Services PMIs (Purchasing Managers’ Index): Surveys that provide a snapshot of activity in key sectors.
- Housing Market Data: Housing starts, existing home sales, and home prices can signal broader economic health.
Conclusion: A Potent Warning, Not a Certainty
The yield curve inversion stands as one of the most historically reliable predictors of a coming recession. Its consistent track record, coupled with sound economic logic explaining why it works (squeezing bank profits, signaling tighter credit, and reflecting pessimistic future expectations), makes it a crucial signal for anyone tracking the economy.
However, it’s vital to remember that it’s a predictor with a variable lag time, not an immediate trigger. It’s a powerful warning sign that encourages prudence and preparation, but not panic. The economy is a dynamic system, and while the yield curve offers a compelling glimpse into the future, it’s just one piece of a much larger, intricate puzzle.
By understanding the yield curve inversion and keeping an eye on other key economic indicators, you can make more informed decisions about your finances, investments, and business strategies, better positioning yourself to navigate the ups and downs of the economic cycle. Stay informed, stay prepared, and remember that knowledge is your best defense against economic uncertainty.


Post Comment