The Economic Early Warning System: How Leading Economic Indicators Can Predict Crises
Have you ever wished you had a crystal ball to see the future? Especially when it comes to your money, your job, or your investments? While no one can predict economic crises with 100% certainty, there are powerful tools that act as an "early warning system": Leading Economic Indicators (LEIs).
Think of them like the weather forecast. They don’t tell you exactly when it will rain, but they can signal a storm is brewing, giving you time to grab an umbrella or change your plans. For the economy, understanding LEIs can give you a significant edge, helping you prepare for potential downturns and protect your financial well-being.
In this comprehensive guide, we’ll break down what Leading Economic Indicators are, explore the most important ones, and explain how you can use them to better understand and even anticipate economic shifts, including potential crises.
What Exactly Are Leading Economic Indicators?
In simple terms, Leading Economic Indicators are economic statistics that tend to change before the overall economy changes. They are forward-looking clues that economists and investors use to forecast future economic activity.
To understand LEIs, it’s helpful to briefly know their cousins:
- Coincident Indicators: These change at the same time as the economy. Examples include Gross Domestic Product (GDP) or personal income. They tell you what’s happening right now.
- Lagging Indicators: These change after the economy has already shifted. Examples include the unemployment rate (which often continues to rise even after a recession has officially ended) or the average duration of unemployment. They confirm trends that have already occurred.
Why Leading Indicators Matter for Crisis Prediction:
LEIs are the "canaries in the coal mine." When several of these indicators start pointing downwards, it suggests that a period of slower growth, or even a recession, might be on the horizon. This early signal is invaluable for individuals, businesses, and policymakers to make informed decisions and prepare.
Your Economic Crystal Ball: Key Leading Economic Indicators
Let’s dive into some of the most important Leading Economic Indicators that economists watch closely. Don’t worry, we’ll explain them in easy-to-understand terms!
1. The Stock Market (S&P 500, Dow Jones Industrial Average)
- What it is: The performance of major stock indexes, which represent the value of shares of publicly traded companies.
- Why it leads: The stock market is often considered a leading indicator because it reflects investors’ expectations about future corporate earnings and economic conditions. Investors are constantly looking ahead, trying to predict which companies will do well (or poorly) in the coming months and years.
- What a negative trend means: A sustained and significant decline in the stock market often suggests that investors are bracing for lower corporate profits and a weaker economy. It can signal reduced consumer spending, declining business investment, or other headwinds.
2. Interest Rate Spreads / The Yield Curve
- What it is: This sounds technical, but it’s crucial. It refers to the difference between the interest rates on long-term government bonds (like 10-year Treasury bonds) and short-term government bonds (like 3-month Treasury bills). Normally, you’d expect to earn more interest for lending money for a longer period (i.e., 10-year rates are higher than 3-month rates).
- Why it leads: When the opposite happens – when short-term rates become higher than long-term rates – it’s called an "inverted yield curve." This is a rare and highly watched phenomenon. It suggests that bond investors are very pessimistic about the short-term future, expecting an economic slowdown or even a recession, which would lead the Federal Reserve to cut rates later on.
- What a negative trend means: An inverted yield curve has historically been one of the most reliable predictors of recessions, preceding nearly every U.S. recession over the past 50 years. It signals a lack of confidence in future economic growth.
3. Building Permits and Housing Starts
- What it is: Building permits are authorizations from local governments to begin construction. Housing starts measure the number of new residential construction projects started in a given month.
- Why it leads: The housing market is a huge part of the economy. Building new homes requires significant investment, employs many workers (construction, real estate agents, furniture makers), and relies on consumer confidence and access to credit. People only buy new homes when they feel secure about their jobs and finances.
- What a negative trend means: A sustained decline in building permits and housing starts indicates that builders are expecting less demand for new homes, signaling a potential slowdown in consumer spending and overall economic activity.
4. Manufacturing New Orders (Durable Goods)
- What it is: This tracks the number of new orders received by manufacturers for "durable goods" – items that are designed to last three years or more, like cars, appliances, machinery, and electronics.
- Why it leads: Businesses don’t order new machinery or components if they don’t expect future demand for their products. New orders are a forward-looking measure of business investment and consumer demand for big-ticket items.
- What a negative trend means: A drop in new orders for durable goods suggests that businesses are pulling back on their production plans, anticipating weaker sales and a general slowdown in the industrial sector, which can ripple through the entire economy.
5. Consumer Confidence Indexes
- What it is: Surveys that measure how optimistic or pessimistic consumers are about the economy, their personal financial situation, and their future job prospects. Examples include the Conference Board Consumer Confidence Index and the University of Michigan Consumer Sentiment Index.
- Why it leads: Consumer spending makes up a huge portion of economic activity (around 70% in the U.S.). When consumers feel confident, they are more likely to spend money on goods and services, which drives economic growth. When they feel uncertain or negative, they tend to save more and spend less.
- What a negative trend means: A significant and sustained drop in consumer confidence can signal that people are worried about their jobs and income, leading them to cut back on discretionary spending. This can directly contribute to an economic slowdown.
6. Initial Jobless Claims
- What it is: The number of people filing for unemployment benefits for the first time each week.
- Why it leads: While the overall unemployment rate is a lagging indicator (it confirms job losses after they’ve occurred), initial jobless claims are more forward-looking. A sudden surge in new claims suggests that companies are laying off workers at a faster pace.
- What a negative trend means: A sustained rise in initial jobless claims indicates that the job market is weakening, which can lead to reduced consumer spending and a broader economic slowdown.
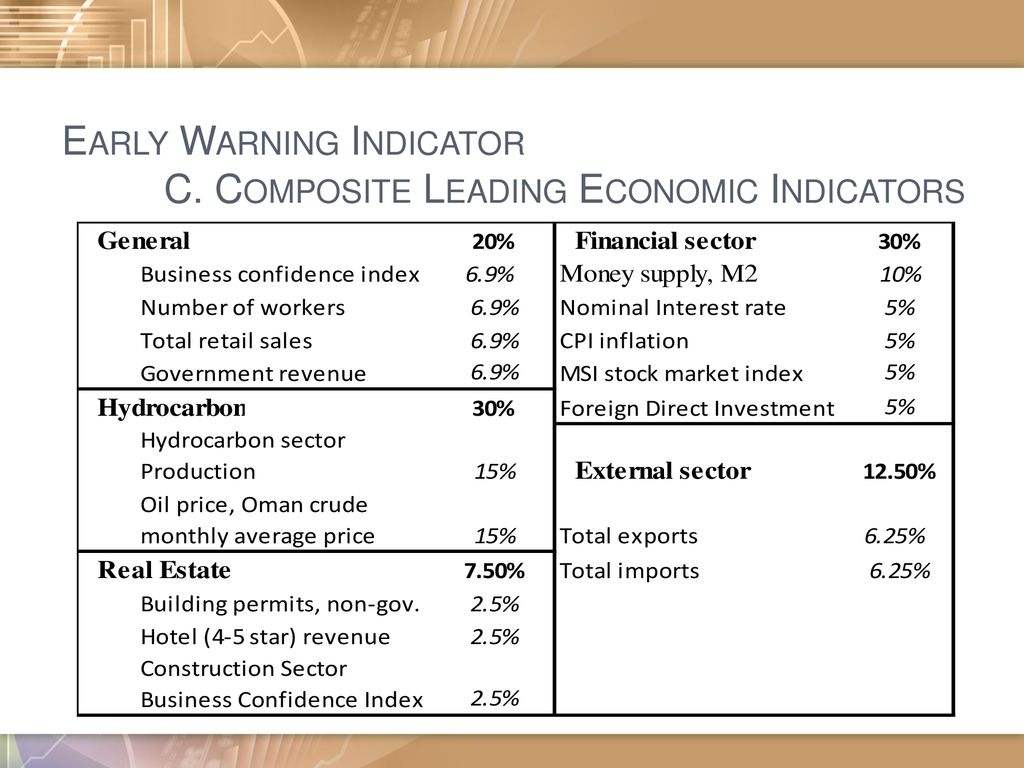
The Power of the "Composite" Indicator
While individual indicators are valuable, economists often look at them together, rather than in isolation. This is where composite indexes come in. The most famous one is The Conference Board Leading Economic Index® (LEI).
- How it works: The Conference Board LEI combines 10 different leading indicators into a single index. This "strength in numbers" approach helps to smooth out volatility and provides a more robust signal than any single indicator alone.
- Why it’s powerful: By combining multiple signals, the composite index provides a more reliable picture of the economy’s future direction. A sustained decline in the composite LEI is often seen as a strong signal of an impending recession.
How to Interpret Leading Indicators for Crisis Prediction
It’s important to remember that using LEIs is more art than perfect science. Here’s how to approach their interpretation:
- Look for Trends, Not Single Data Points: Don’t panic over one bad month of housing starts. Look for a consistent pattern of decline over several months across multiple indicators.
- Context is Key: Economic indicators don’t operate in a vacuum. Consider what else is happening globally – geopolitical events, major policy changes, natural disasters, or global health crises can all influence economic outcomes.
- No Single Indicator is a Guarantee: Even the most reliable indicators can sometimes give false signals. An inverted yield curve, while highly accurate, has still had a few "false positives" over time where a recession didn’t immediately follow.
- Understand the Lag Time: Leading indicators lead, but by how much? It varies. An inverted yield curve might precede a recession by 12-18 months, while a drop in consumer confidence might be a shorter lead time.
- It’s About Probability, Not Certainty: LEIs increase the probability of a crisis, they don’t guarantee one. They give you a heads-up to start thinking about preparing, not to panic.
- Watch for Divergence: If some LEIs are pointing up while others are pointing down, the signal is less clear. A stronger signal emerges when many or most leading indicators are moving in the same direction.
Why Leading Indicators Are Crucial for Your Crisis Preparedness
Understanding Leading Economic Indicators isn’t just for economists and policymakers. It empowers you to:
-
Make Informed Financial Decisions:
- Investments: If you see a cluster of negative LEIs, you might consider adjusting your investment strategy, perhaps by increasing cash reserves or rebalancing your portfolio.
- Savings: A potential downturn is a good time to build up your emergency fund.
- Debt: Consider paying down high-interest debt if a crisis seems likely, freeing up cash flow.
-
Plan for Your Career and Business:
- Job Security: If the job market looks like it’s weakening (rising initial jobless claims), you might focus on skill development or networking.
- Business Strategy: Business owners can use LEIs to anticipate changes in demand, adjust inventory, or re-evaluate hiring plans.
-
Reduce Anxiety: While economic news can be stressful, understanding the underlying signals helps you feel more in control. You’re not just reacting to headlines; you’re interpreting the data.
Limitations and Nuances
While incredibly useful, LEIs aren’t perfect:
- False Signals: Sometimes, an indicator might dip, but the economy recovers quickly without a full-blown crisis.
- Unexpected Shocks: LEIs are based on historical patterns. They might not fully capture the impact of entirely new, unforeseen events (like a sudden pandemic or a major war).
- Evolving Economy: As the economy changes (e.g., the rise of the service sector, digitalization), the relevance of some traditional indicators might shift, and new ones may emerge.
Conclusion: Be Your Own Economic Navigator
Leading Economic Indicators are not a magic crystal ball, but they are the closest thing we have to an economic early warning system. By understanding and regularly checking these key signals, you can become a more informed investor, a more prepared individual, and a more resilient financial planner.
Instead of being caught off guard by economic storms, you can use these indicators to anticipate potential turbulence, adjust your sails, and navigate your financial future with greater confidence. Stay curious, stay informed, and empower yourself with the knowledge to read the economic road ahead.
Frequently Asked Questions (FAQs)
Q1: Where can I find data on Leading Economic Indicators?
A: You can find data from various reputable sources:
- The Conference Board: For their composite Leading Economic Index (LEI).
- Federal Reserve Banks (e.g., FRED from the St. Louis Fed): For historical data on interest rates, unemployment claims, etc.
- U.S. Census Bureau: For housing starts and building permits.
- U.S. Bureau of Economic Analysis (BEA): For durable goods orders.
- University of Michigan/Conference Board: For consumer confidence surveys.
- Major Financial News Outlets: They often report these figures as they are released.
Q2: How far in advance do LEIs predict a crisis?
A: It varies depending on the indicator and the specific economic cycle. The inverted yield curve, for example, has historically preceded recessions by an average of 12-18 months. Other indicators might have shorter lead times. It’s not a precise clock, but rather a warning bell that rings well in advance.
Q3: Are LEIs only useful for predicting recessions?
A: No! While often highlighted for crisis prediction, LEIs also signal periods of strong economic growth. A sustained rise in LEIs suggests an expanding economy, which can inform investment decisions, hiring plans, and personal spending.
Q4: Should I change all my investments if LEIs point to a crisis?
A: Not necessarily. It’s crucial to consult with a financial advisor who can help you understand how LEI signals fit into your personal financial situation, risk tolerance, and long-term goals. LEIs are a tool for informed decision-making, not a trigger for panic. Diversification and a long-term perspective often remain key, even in challenging economic times.
Q5: What’s the biggest misconception about Leading Economic Indicators?
A: The biggest misconception is that they are perfect predictors. They are not. They are statistical probabilities based on historical patterns. External shocks, policy changes, and the evolving nature of the economy mean that no indicator or set of indicators can offer a 100% guarantee of future events. They provide valuable foresight, but always with a degree of uncertainty.


Post Comment